Multi-site acute-care network · West India · Major metropolis · 100k+ encounters · 4 care settings · one network record
One platform from ambulance to OR
Anonymized deployment · reference conversations arranged for qualified evaluations
4
care settings on one record — ER, OR, ICU, ambulance
1
audit log across the patient journey
4–6h
earlier sepsis foresight, pre-clinical
100k+
encounters on the platform
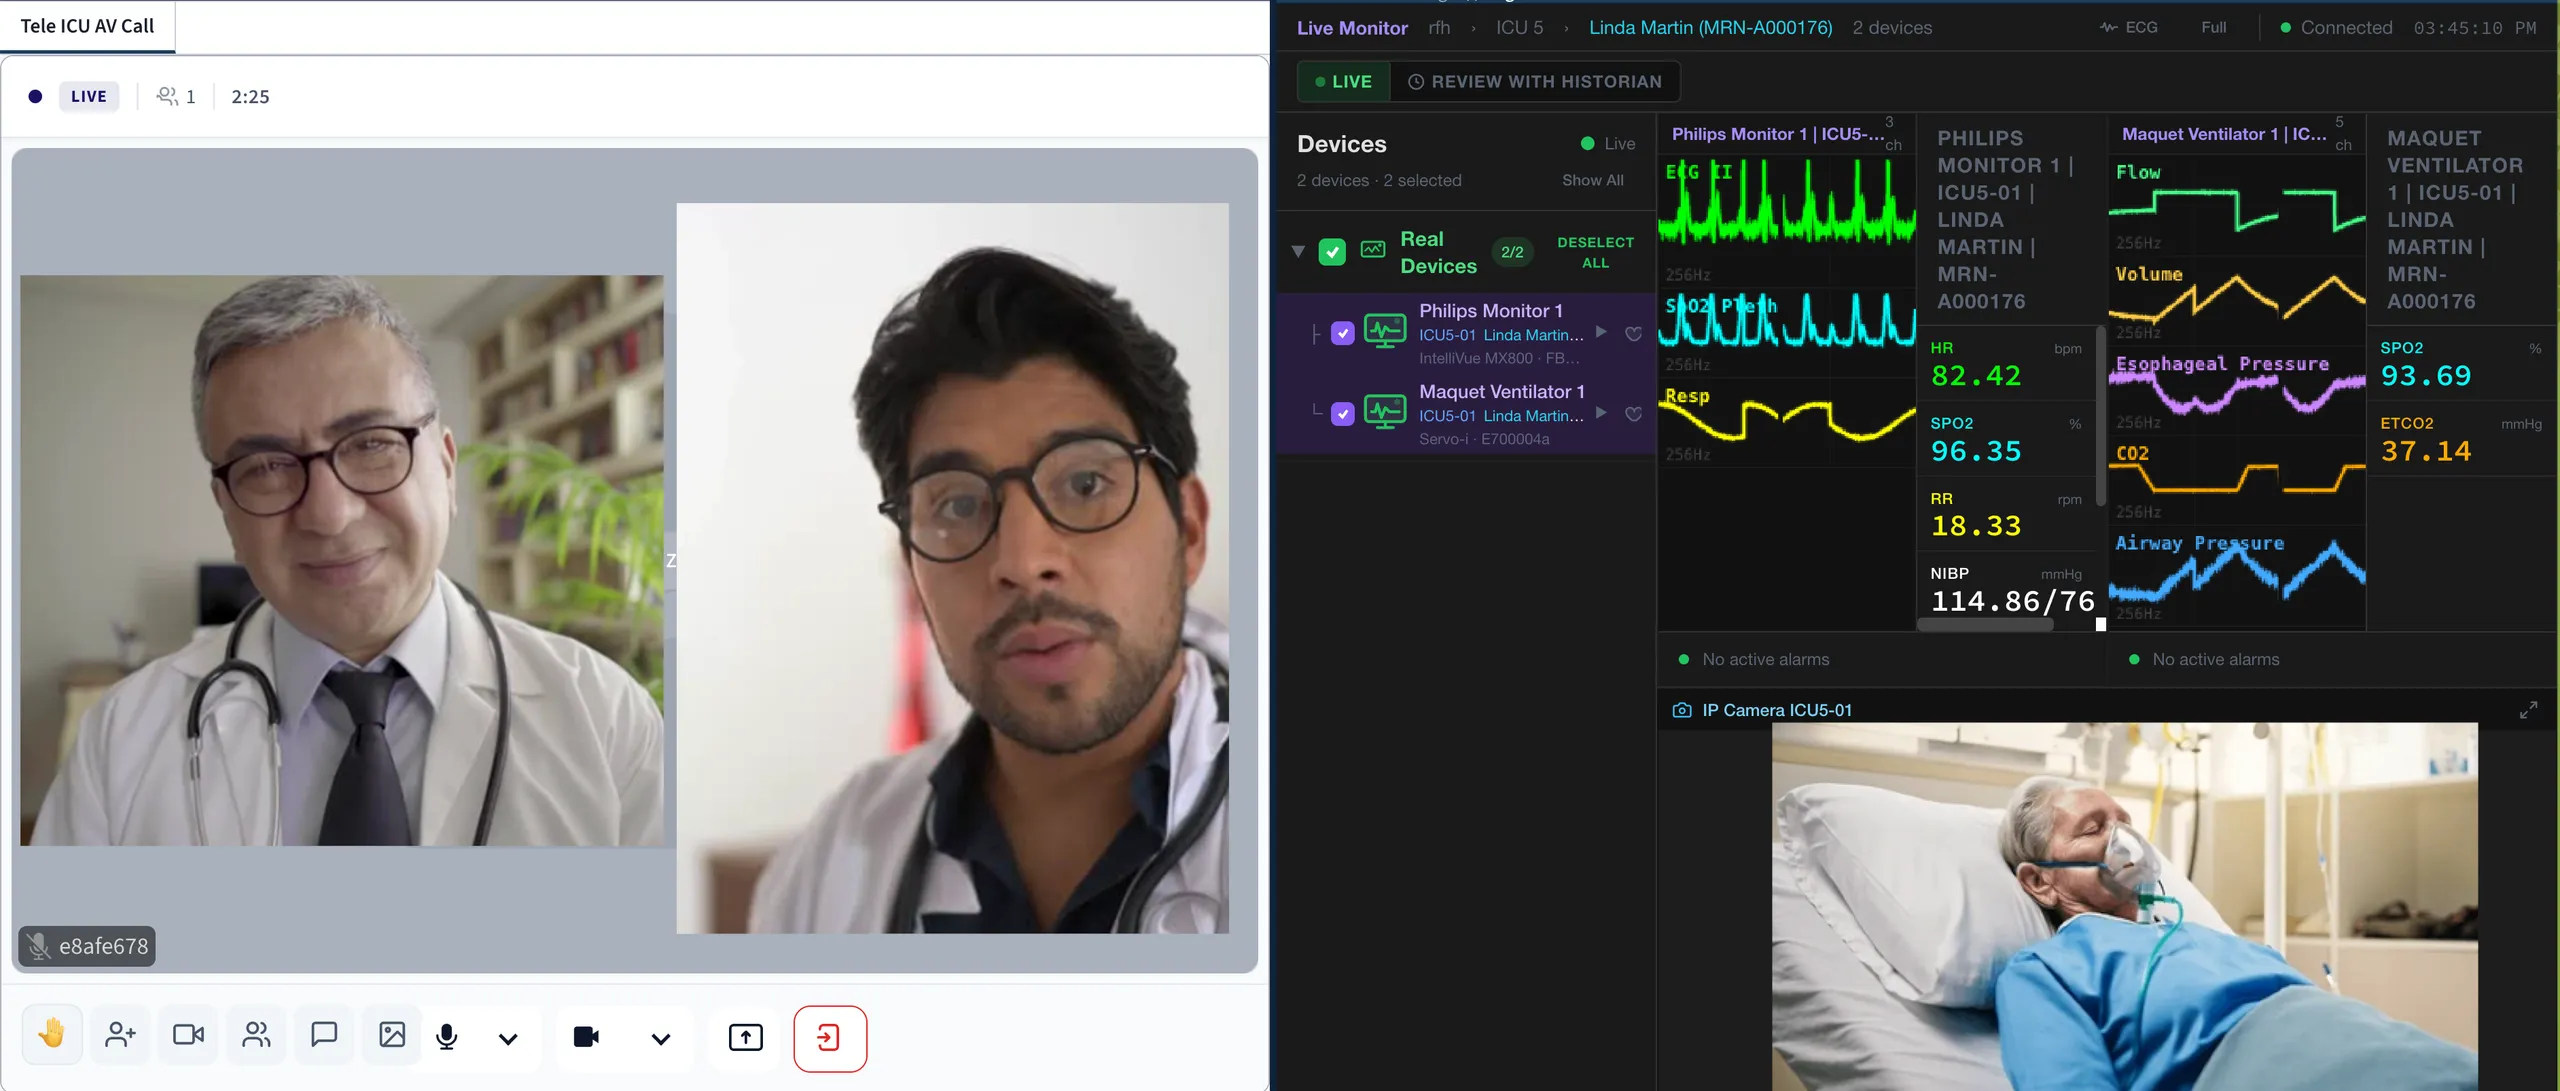
A hospital network running emergency, operating theatres, intensive care and its ambulance fleet on zMed: the chart opened in the field reaches the ED before the patient does, the anaesthesia record auto-populates in theatre, and the same record follows the patient to the ICU and through discharge — one record, one audit trail, end to end.
The challenge
A patient who arrives by ambulance, passes through the emergency department, goes to theatre and recovers in intensive care has — in most acute networks — passed through four record systems and at least three verbal handovers. Every doorway meant re-telling and re-keying: the crew’s observations dictated to the triage nurse, the ED notes summarised for the anaesthetist, the theatre record reconstructed for the ICU team. Each retelling loses detail, and each system boundary breaks the audit trail. When the network’s leadership asked a simple question — what happened to this patient, from first contact to discharge? — the honest answer had to be assembled by hand from four places.
The deployment
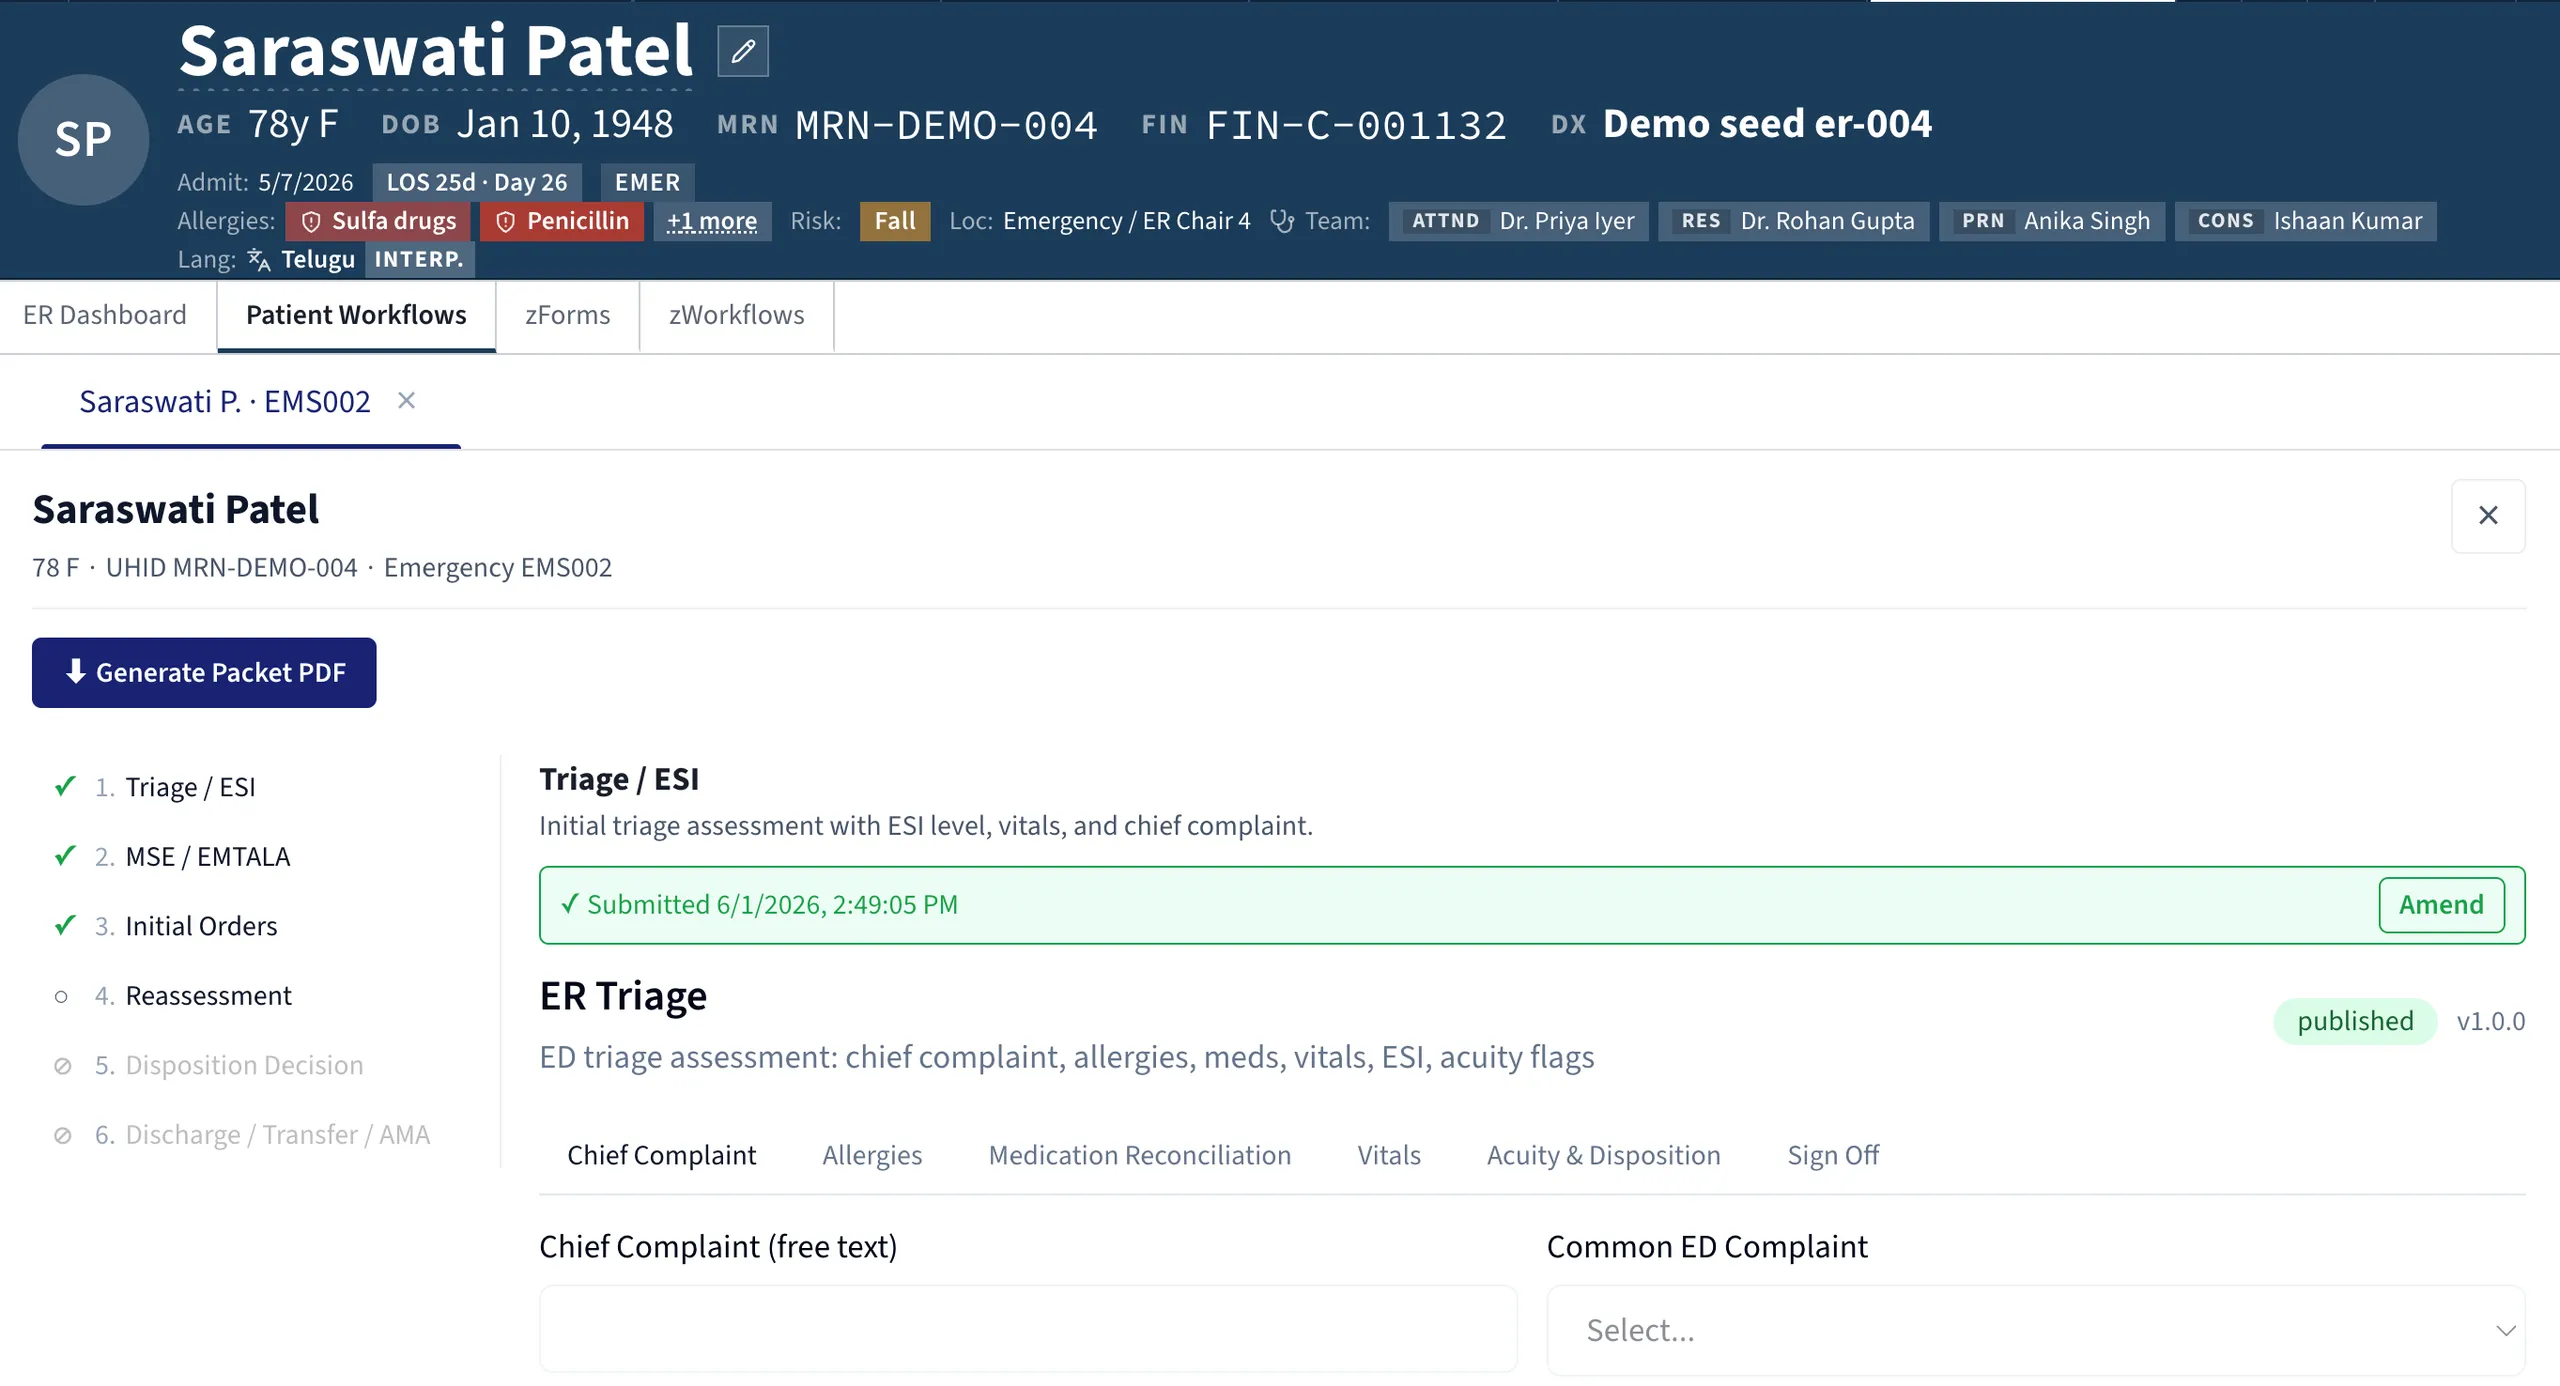
The network put all four care settings on one record. The chart opens in the ambulance: crew observations, interventions and timings are captured in the field and reach the emergency department before the patient does, so triage begins from real data rather than a blank screen. In theatre, the anaesthesia record auto-populates within the same patient context, and the record then follows the patient into intensive care and through to discharge without a single re-key.
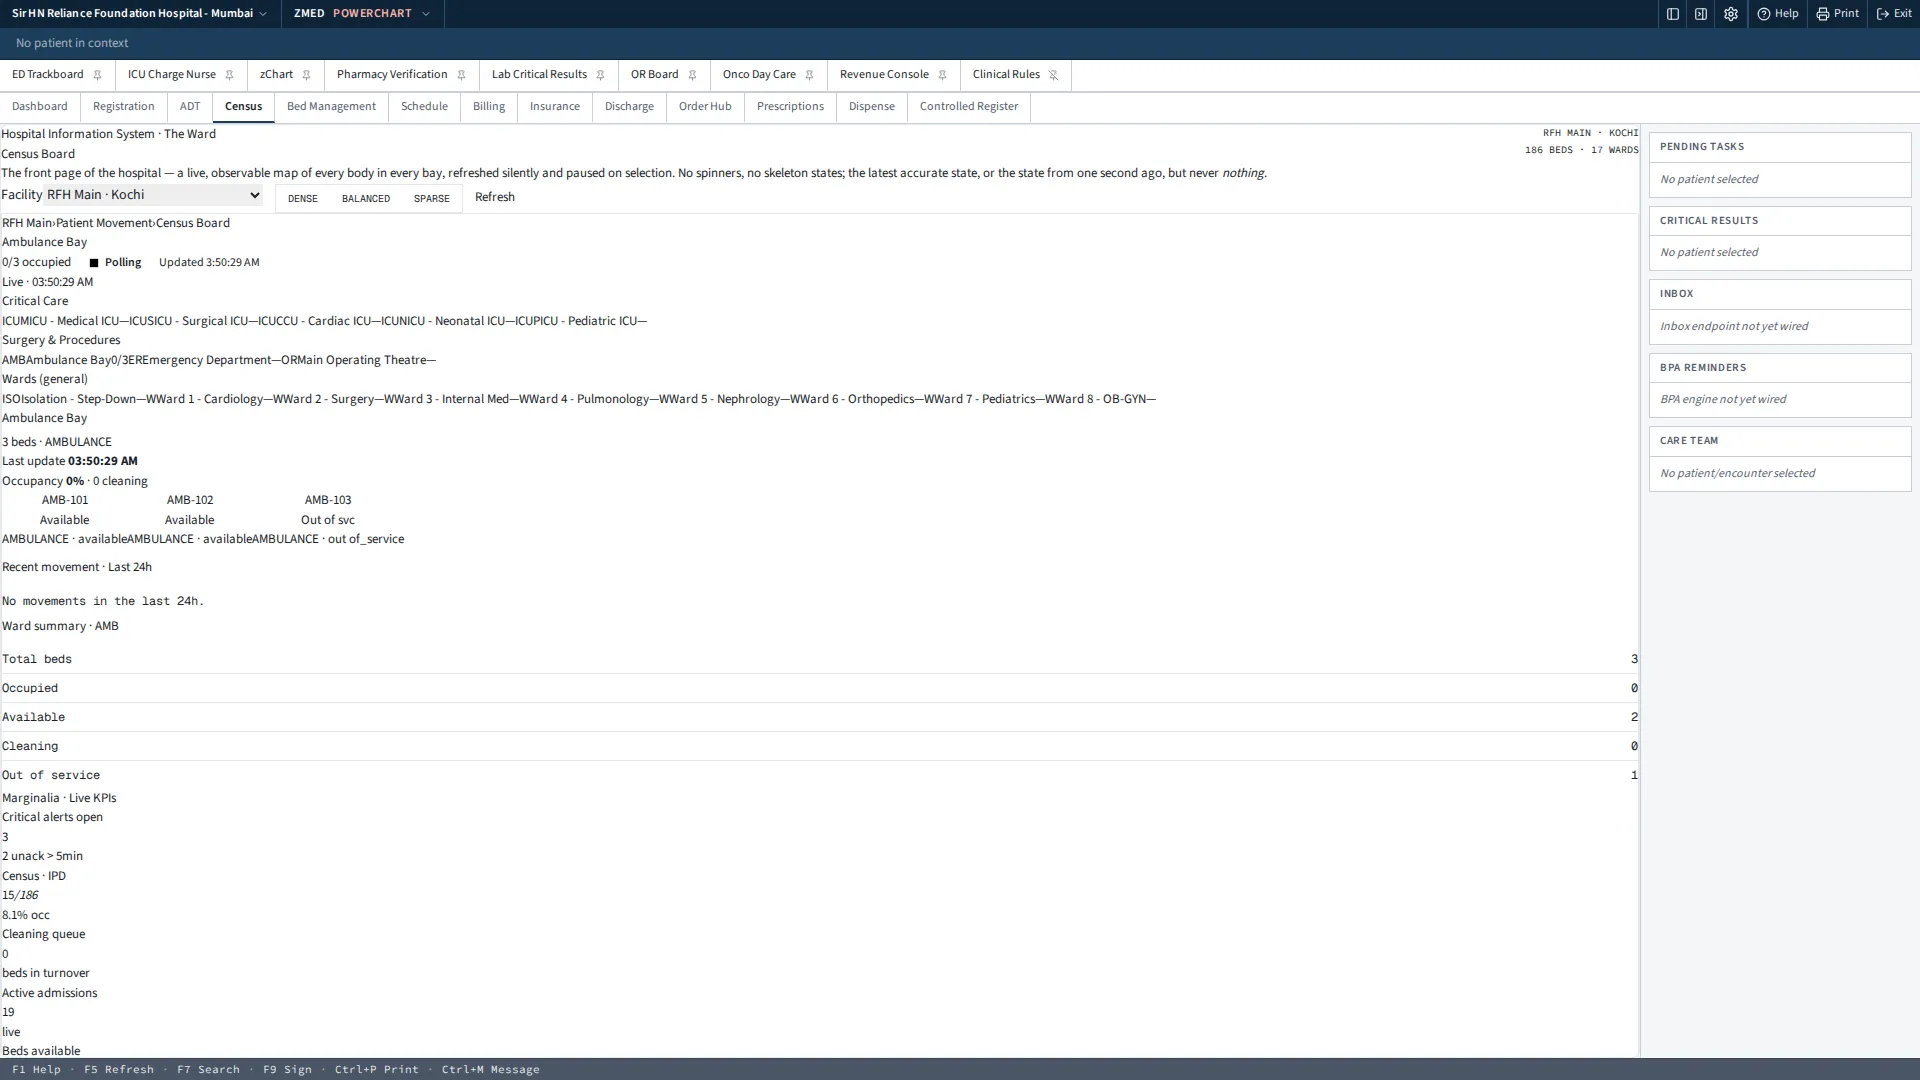
Above the individual encounter sits the network view. A tele-ICU command centre lets senior intensivists watch monitored beds across sites from one screen, and a live census shows occupancy and patient flow across the whole network in real time rather than in a morning report. Continuous sepsis surveillance runs across the record itself, flagging patients before clinical signs declare themselves at the bedside.
The rollout moved setting by setting — emergency first, then theatres, then intensive care, then the fleet — so each team went live on a record that its upstream colleagues were already writing into.
What changed
Four care settings on one record. ER, OR, ICU and ambulance share a single chart. The handover conversation still happens — but it confirms what the receiving team can already read, instead of being the only copy of it.
One audit log across the patient journey. Every entry, every clinician, every timestamp in a single trail from first contact to discharge. Quality reviews and audits that once meant reconciling systems now mean reading one record.
4–6 hours of earlier sepsis foresight, pre-clinical. Because the record is continuous across settings, surveillance never loses sight of the patient at a transfer — the hours when deterioration most often slips through.
100k+ encounters on the platform. This is not a pilot ward. It is the network’s working record, at metropolitan volume, across every acute setting it operates.
What the team says
The feedback from the floor is consistent across settings, and practical rather than technical. Emergency nurses describe preparing for a patient they can already see — vitals, interventions and timings from the field on screen before the vehicle arrives. Anaesthetists describe a theatre record that is ready when the patient is, rather than one built from scratch at induction. Intensivists say the history is simply there: what was given in the ambulance, what happened in the ED, what was done in theatre, in one continuous chart. And the quality and audit teams — usually the last to benefit from any clinical system — describe answering in minutes the journey-level questions that used to take days of reconciliation.
Every figure above is measured as described on the methodology page. Thinking about replacing an incumbent system? Here is how the seam is managed.