Clinical AI (Comprehensive)
“Is this about to happen?”
Deterioration prediction, sepsis foresight and demand forecasting — surfaced inside the live chart, explainable, and advisory only.
4–6h
sepsis surfaced before clinical declaration
28,000+
chart rows a day in a 20-bed ICU — every one read
100%
advisory only, explainable, audit-logged
What you get
Built for the unit, used by the clinician
- Deterioration prediction
- Sepsis 4–6 hrs pre-clinical
- Demand & occupancy forecasting
- Explainable, advisory only
Overview
The temptation when adding AI to a clinical platform is to ship a sidebar widget and call it intelligence. zMed did not take that route. The platform's clinical intelligence is built into the workflows clinicians already run — it surfaces risk when the trend bends, drafts the words when the chart needs them, and explains itself when the clinician asks. It does not ask the clinician to learn a new app, switch screens, or type into a prompt.
The scale is the point. A single ventilated patient generates over fourteen hundred chart-able data points a day; a twenty-bed ICU is more than 28,000 rows a day pouring into a flowsheet that, traditionally, sits as a static grid. Less than five percent is read before the next clinical decision. zMed's intelligence reads every row and every waveform, every minute — and everything it finds lands back in the chart, not in a separate tab.
Predictive models
Rules answer "is this happening now?". The predictive layer answers "is this about to happen?" — every model fitted on your hospital's own historical cohort, never a black-box vendor model, with the validation cohort and results visible to your clinical informatics team.
- Mortality risk
- A continuous risk score and tier for every ICU patient from the first day of stay, recomputed daily — surfaced as a Live Monitor tile colour and a chart trend curve.
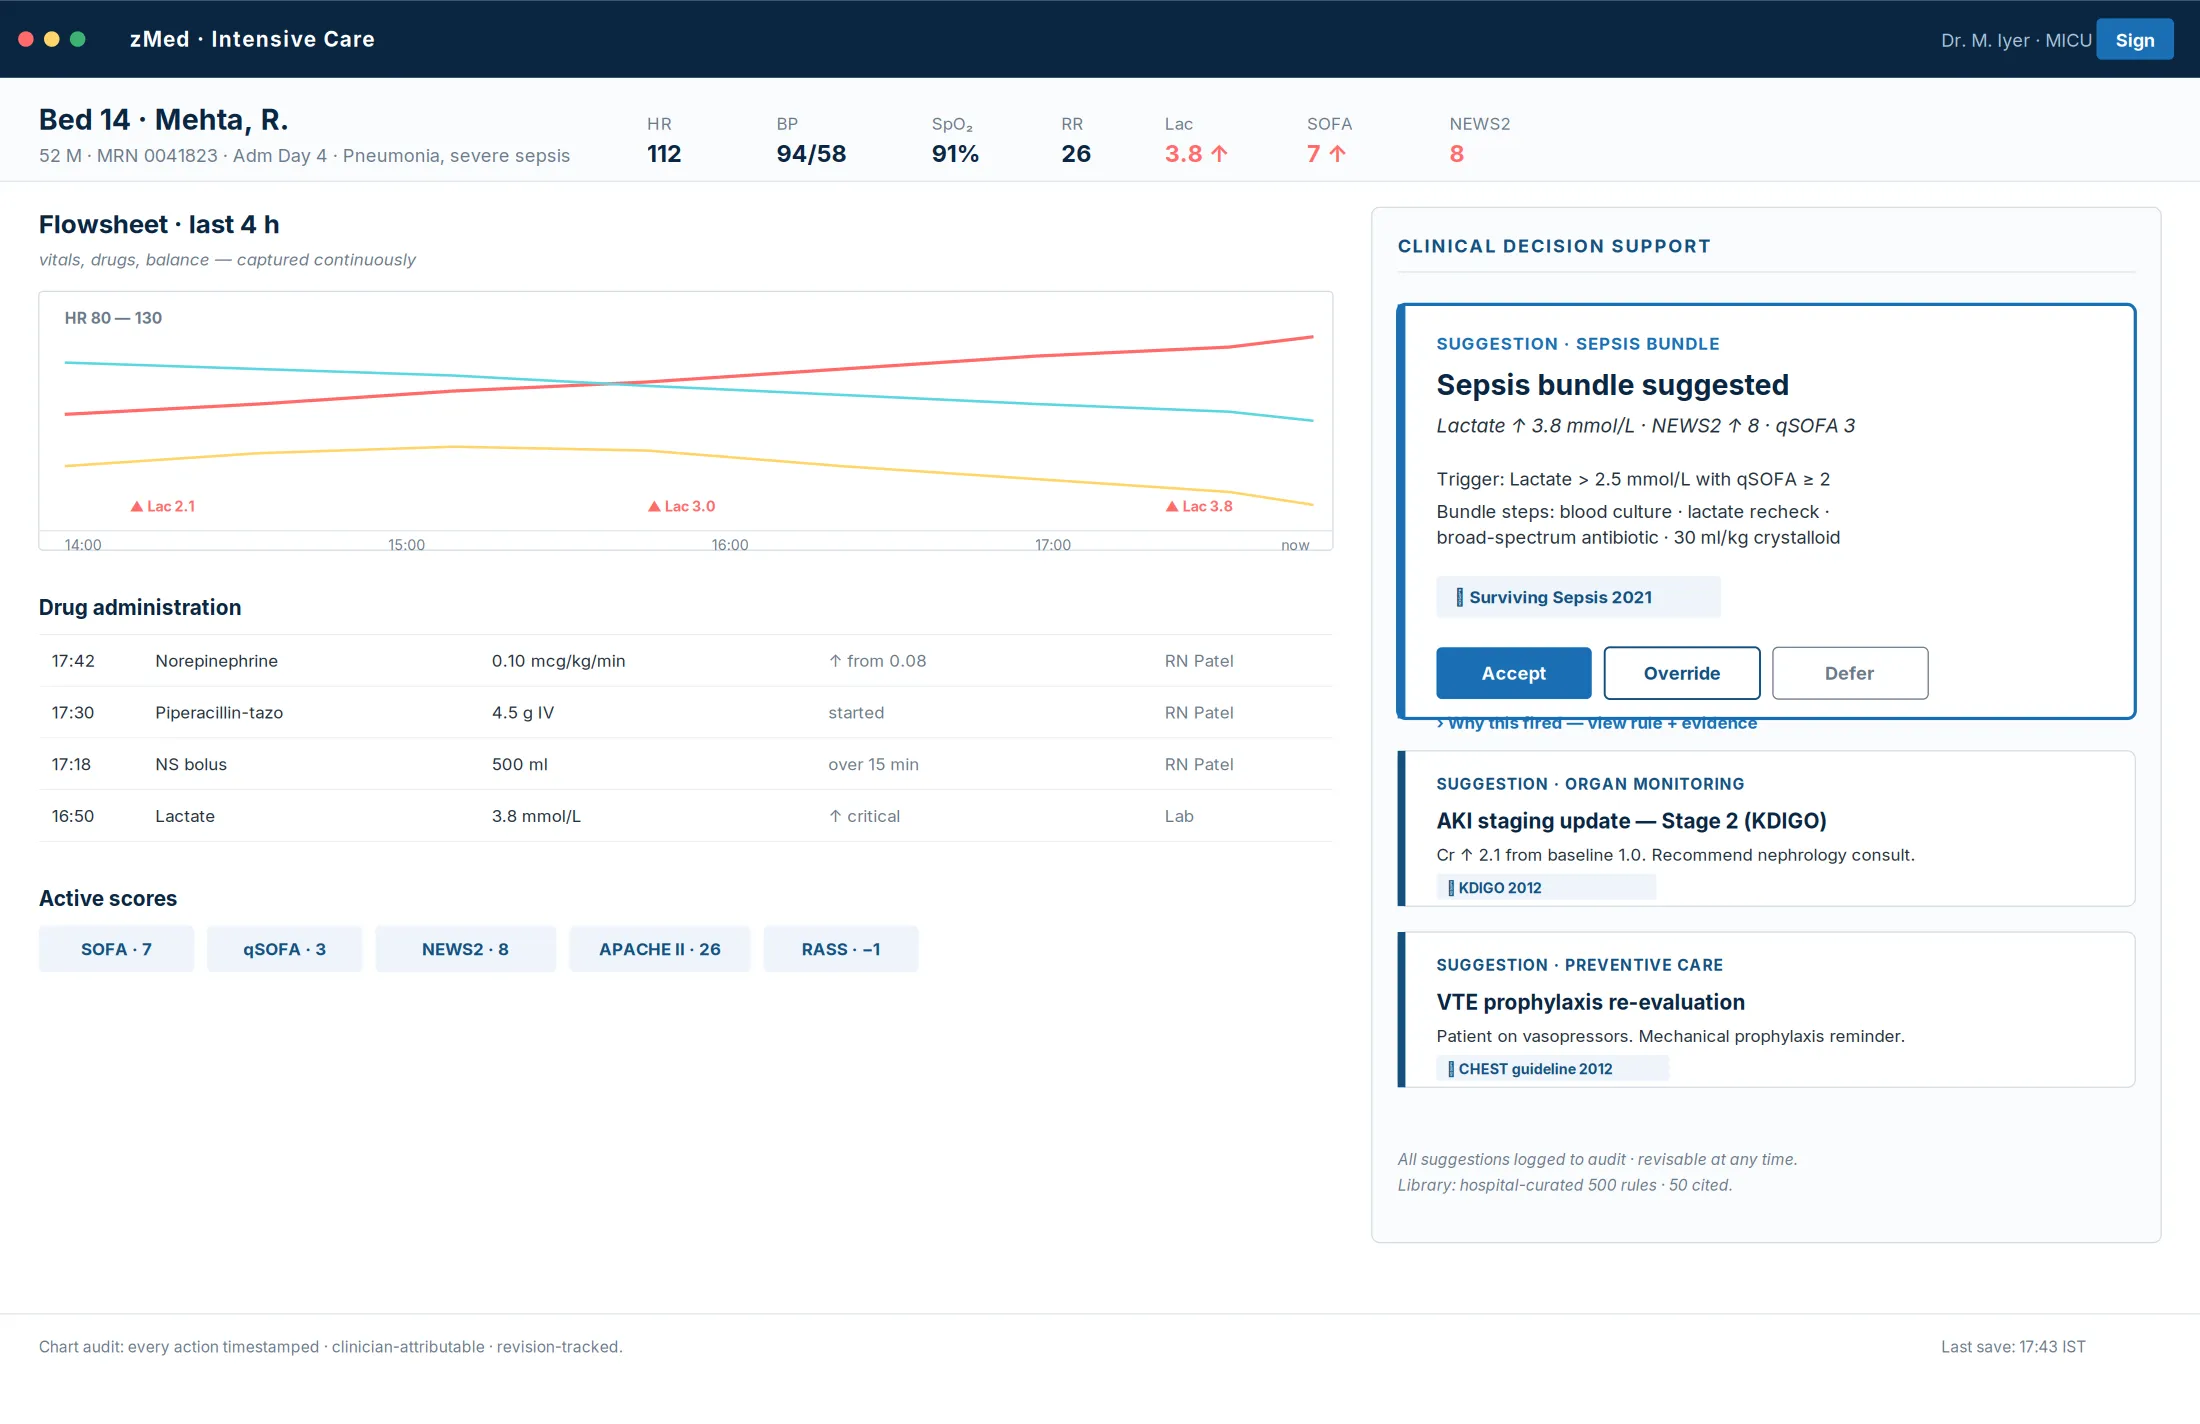
- Sepsis trajectory
- Watches the live observation stream for the quiet early signatures — small persistent rises in heart rate, drifts in mean arterial pressure, lactate trends — and composes them into a risk band refreshed every fifteen minutes through the critical first day, surfacing sepsis 4–6 hours ahead of clinical declaration.
- Deterioration & instability
- Continuous early-warning scoring for every inpatient, recomputing as new data arrives, feeding escalation rules and the unit-wide view.
- 30-day readmission
- Scores every discharge plan and surfaces inline on the discharge-planning view, flagging the patients who need a structured intervention before they leave.
- Demand & occupancy forecasting
- The same analytics layer extends past the patient to the unit — census and capacity foresight so leadership plans ahead instead of reacting.
Waveform analytics — real-time signal analysis
The bedside delivers continuous waveforms at the device's native sample rate — ECG, plethysmograph, capnograph, ventilator pressure/volume/flow, invasive arterial pressure. A curated detector library analyses every channel in real time — available as configurable clinical intelligence modules, subject to customer validation and the applicable regulatory pathway.
- Lethal-rhythm detection
- Ventricular fibrillation, ventricular tachycardia and asystole detected within seconds of waveform receipt — with built-in self-cooldown so the same arrhythmia does not page the clinician forty times in a minute.
- ECG morphology drift
- QRS-width trends, onset of conduction disease, ST-segment elevation and depression trends — caught as drift, not as a crisis.
- Ventilator waveform analysis
- Tidal volume, plateau and driving pressure, PEEP creep, patient–ventilator asynchrony, double-triggering and breath-stacking — with respiratory severity scoring reading directly from the analytics rather than a manually charted entry.
- Capnograph & perfusion analysis
- End-tidal CO₂ waveform shape and trend, rebreathing patterns, perfusion-index trend and perfusion-failure surveillance from the plethysmograph.
- Every detection lands in the flowsheet
- Each finding is written into the chart as an observation with its timestamp, detector identity and the contributing waveform window attached — consumed by the same rules, scores and predictions as any hand-charted value. One flowsheet, one source of truth.
AI-drafted words
Where the predictive layer surfaces risk, the drafting layer surfaces words. It drafts; the clinician edits and signs.
- Rationale drafts
- When a rule fires, the AI drafts the one-line rationale citing the underlying observations and the relevant guideline — a written explanation, not just a flag.
- Shift & discharge drafting
- Structured handover summaries of the last twelve hours — events, score trends, bundle adherence, outstanding tasks — plus discharge summaries, medication reconciliation and patient-facing instructions.
- Clinical narratives
- Structured delirium narratives when an assessment turns positive, and one-line trend descriptions when a flowsheet row bends in a concerning direction.
- What it never does
- It places no orders, signs no documents, and never skips the clinician's review. Every output is timestamped, attributed to the model revision, and stored alongside the clinician's edits in the audit log.
Trust & governance
- Explainable by construction
- Every suggestion shows the rule or model that produced it, the contributing observations, and the citation when present — the clinician can always independently review the basis.
- Advisory only, always
- zMed makes no diagnosis, prescribes no medication, orders no procedure, and discharges no patient. Every output is one tap from override, and the chain of clinical responsibility flows through the human clinician at every step.
- Regulatory posture
- Designed with advisory, explainable, human-in-the-loop CDS principles. Final regulatory classification depends on intended use, deployment configuration, clinical claims, and jurisdiction. The audit log is the inspector's primary artefact.
- Your data, your boundary
- Models run in a secure environment and can run fully on-premises; patient data is never used to train shared or third-party models, and protected health information is redacted before any cloud model is invoked.
The strategic conviction underneath is plain. Models are commodities — they improve, they get cheaper, they get swapped. The durable advantage is the vertical intelligence built around the clinical workflow: the integration into the flowsheet, the governance discipline, the hospital ownership of thresholds and revision cycles, the audit trail that makes every output defensible. That is the moat, and it is what turns a static grid of numbers into a clinical co-pilot that always defers to the human in the loop. The deterministic layer these models work alongside — the rules engine, the ~500-rule library, the automated clinical scores, the care-bundle state machines and smart alarm management — is covered under Clinical Decision Support.
Explore more
Other modules & products
ICU & Critical Care
Every bedside signal, read every minute
Tele-ICU & Command Center
One specialist, every bed, every site
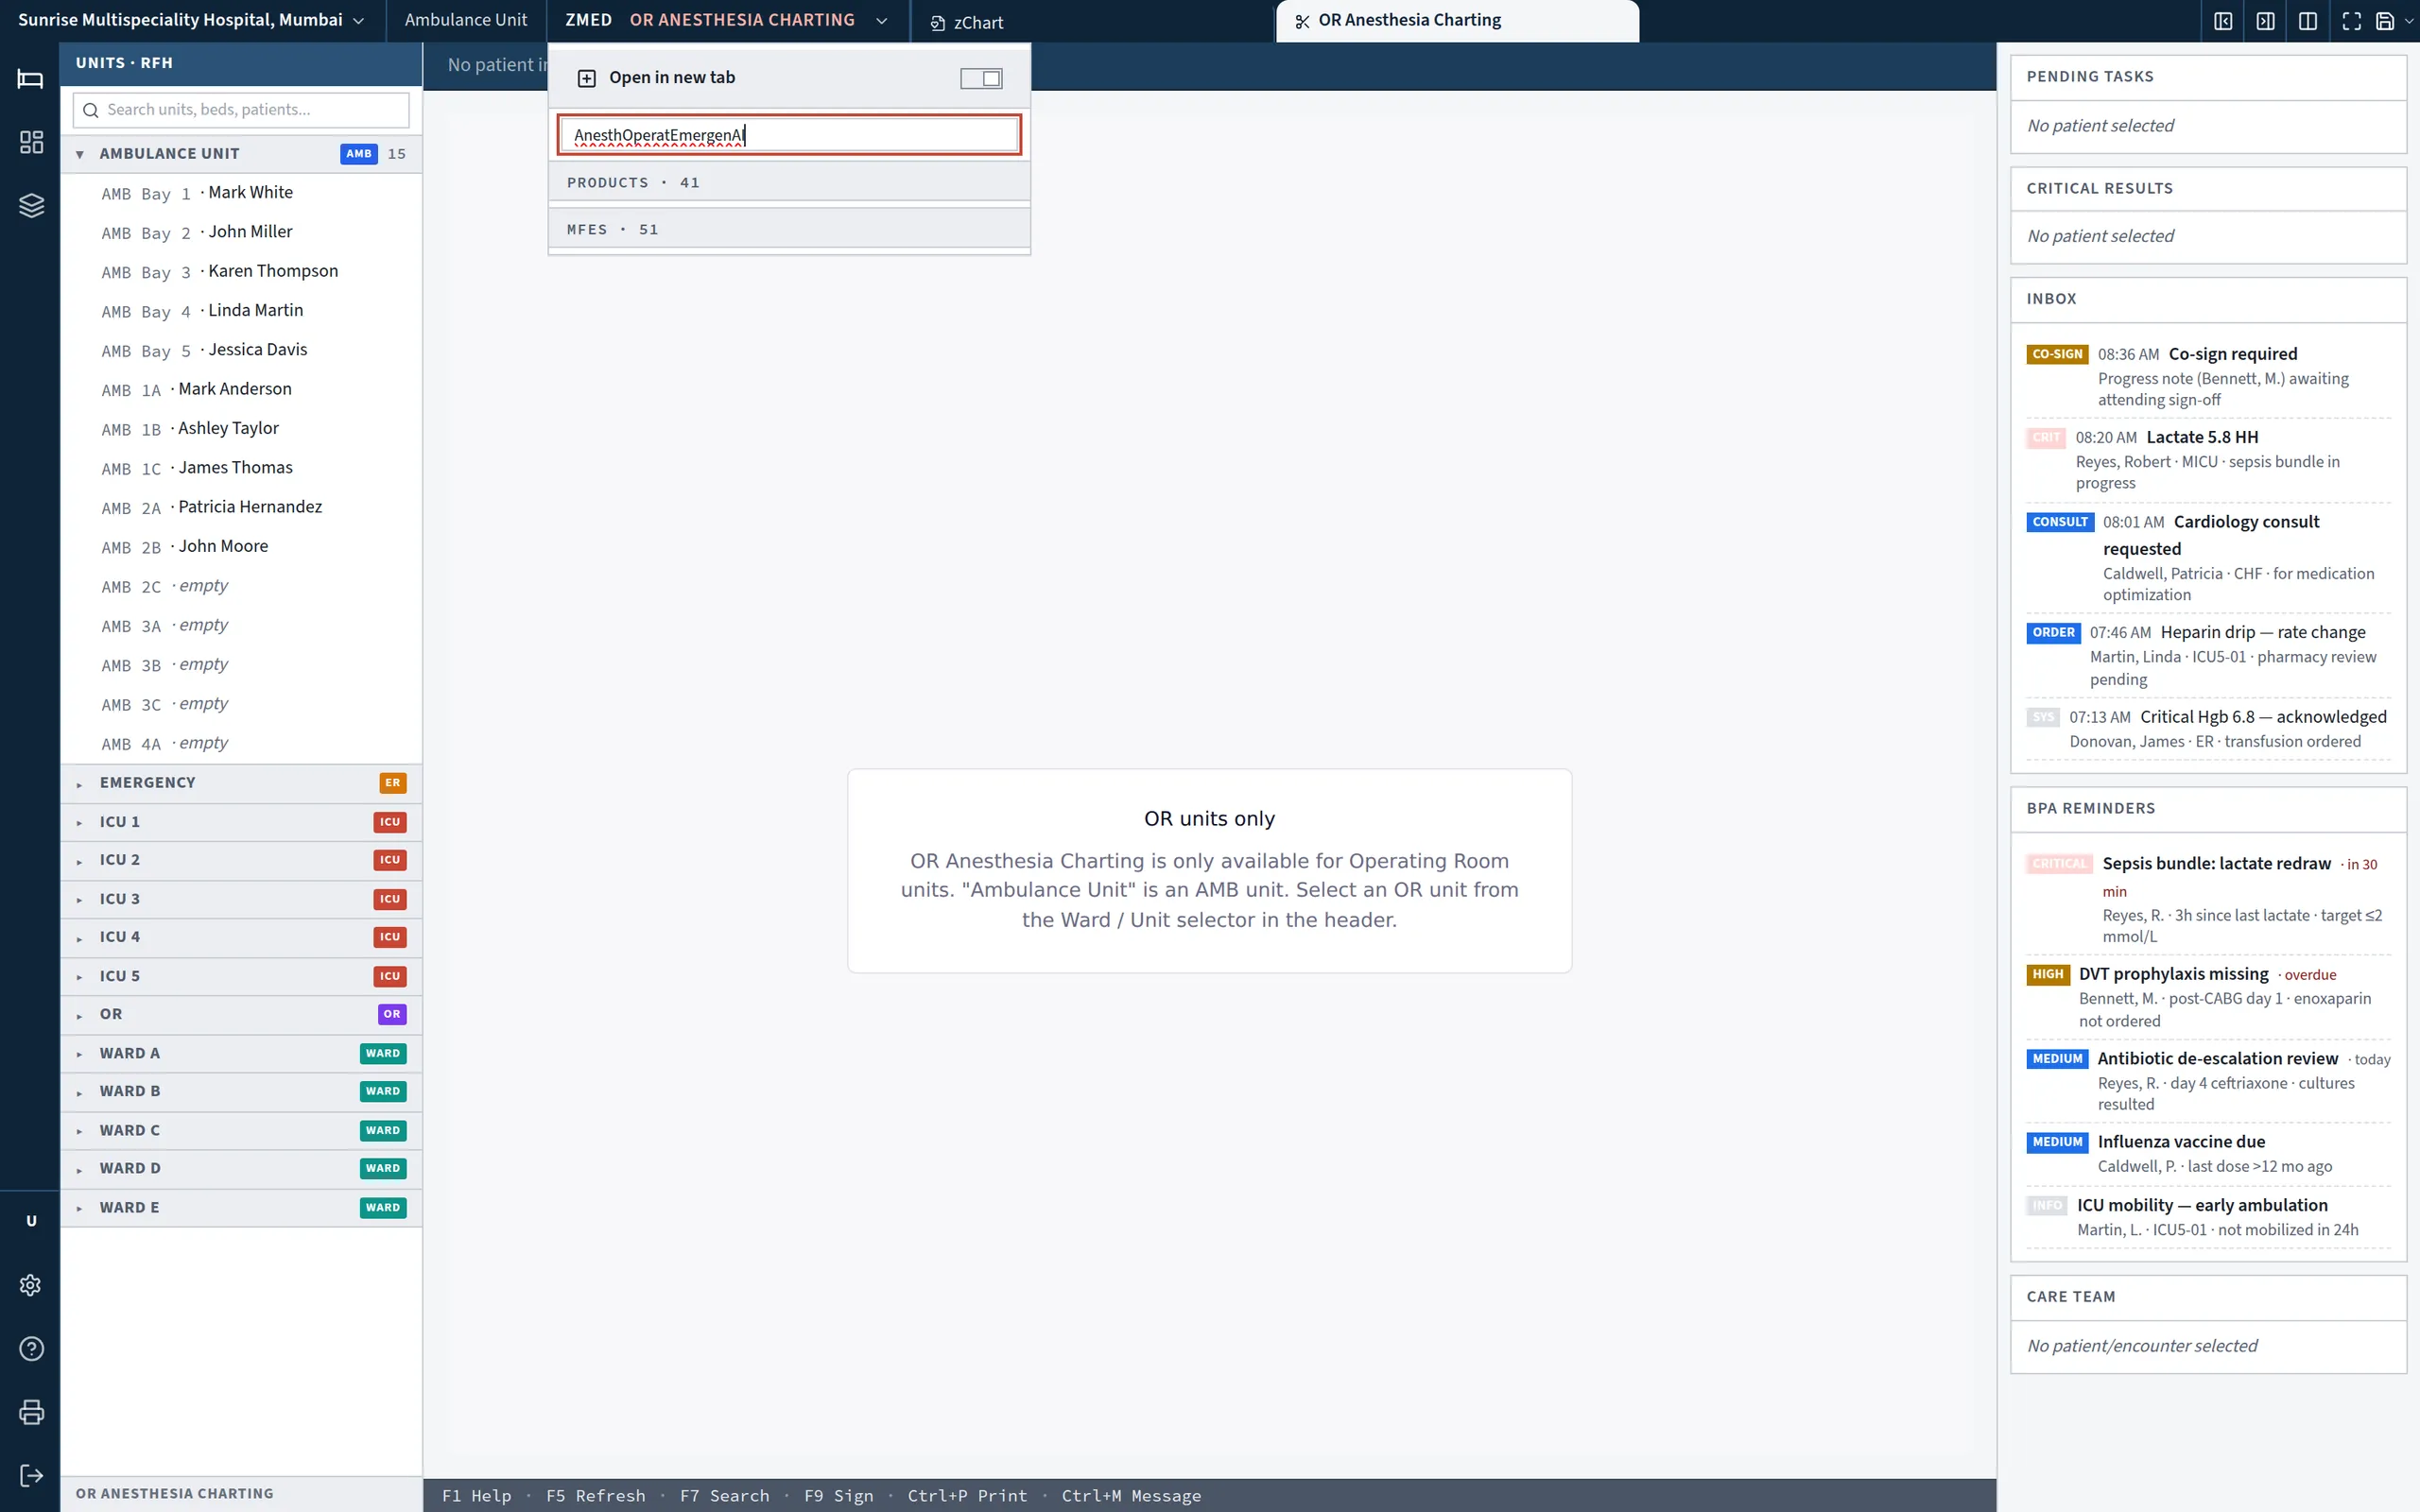
Operating Room & Anaesthesia
The chart that writes itself
Emergency & Triage (ER)
The pathway opens at the door
Ambulance & Pre-Hospital
Care that starts before arrival
HIS & ERP
One platform, not two systems
Clinical Decision Support (Comprehensive)
Guidance where the decision is made