ICU & Critical Care
Every bedside signal, read every minute
One living flowsheet that ingests every monitor, pump and ventilator, recalculates twelve scores continuously, and keeps the whole unit in view.
1,400+
chartable points per ventilated patient per day
12
clinical scores recalculated continuously
60–85%
reduction in alarm load
What you get
Built for the unit, used by the clinician
- Live vitals & waveforms
- Twelve scores, recalculated
- Smart alarm reduction
- Unit-wide Live Monitor
Overview
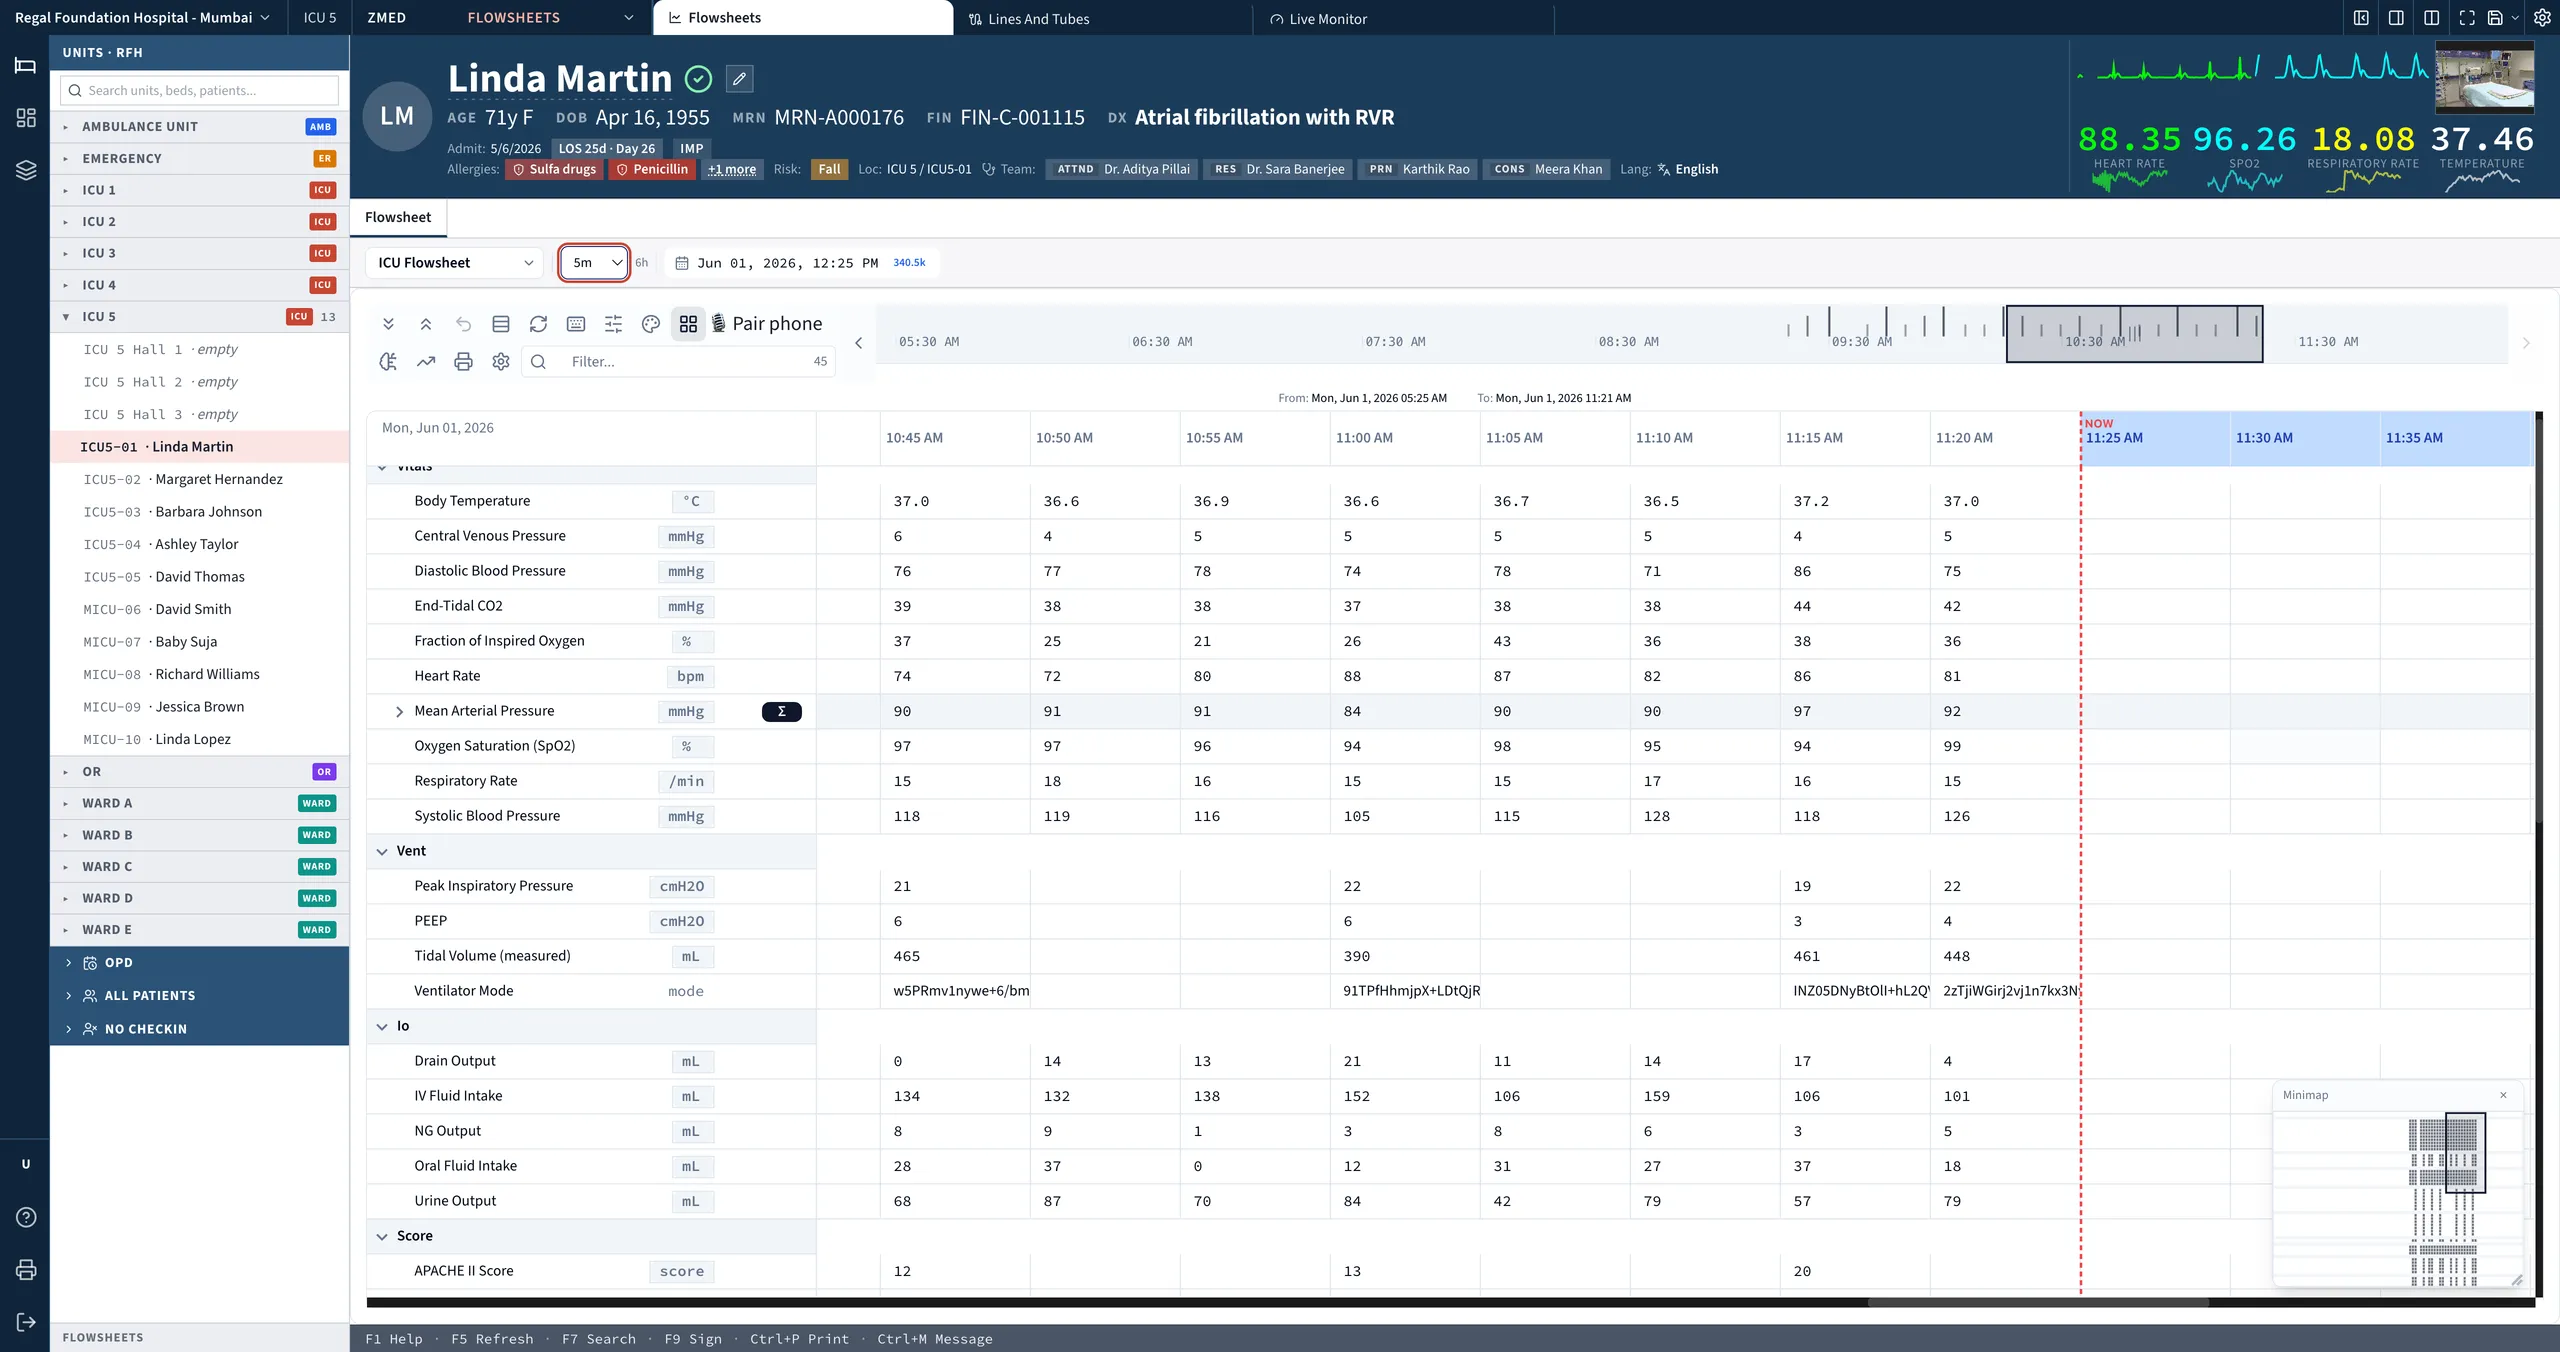
zMed's intensive care module is the platform's flagship: a single integrated chart that ingests every bedside signal, runs every score continuously, fires every rule the moment its threshold trips, and produces every record the unit needs. The premise is simple — a patient declining at 03:00 does not have time for the nurse to switch screens, the charge to consult the paper, and the intensivist to reconstruct the trend from memory. The system has to be one screen, and that screen has to know.
The flowsheet is the chart. Every vital, every drug, every observation, every fluid and every intervention is captured at the cadence the protocol demands and displayed at the resolution the clinician needs — hour-level, minute-level or beat-level, switchable on the chart. It handles adult, paediatric and neonatal patients on the same engine, with templates owned by the hospital and changeable the day a protocol changes, with no engineering involvement. Monitor vitals, ventilator settings, infusion rates and dialysis parameters flow in automatically; drug and fluid balance total in real time, traceable to source; and an event timeline lets a clinician reconstruct an entire shift in one scroll.
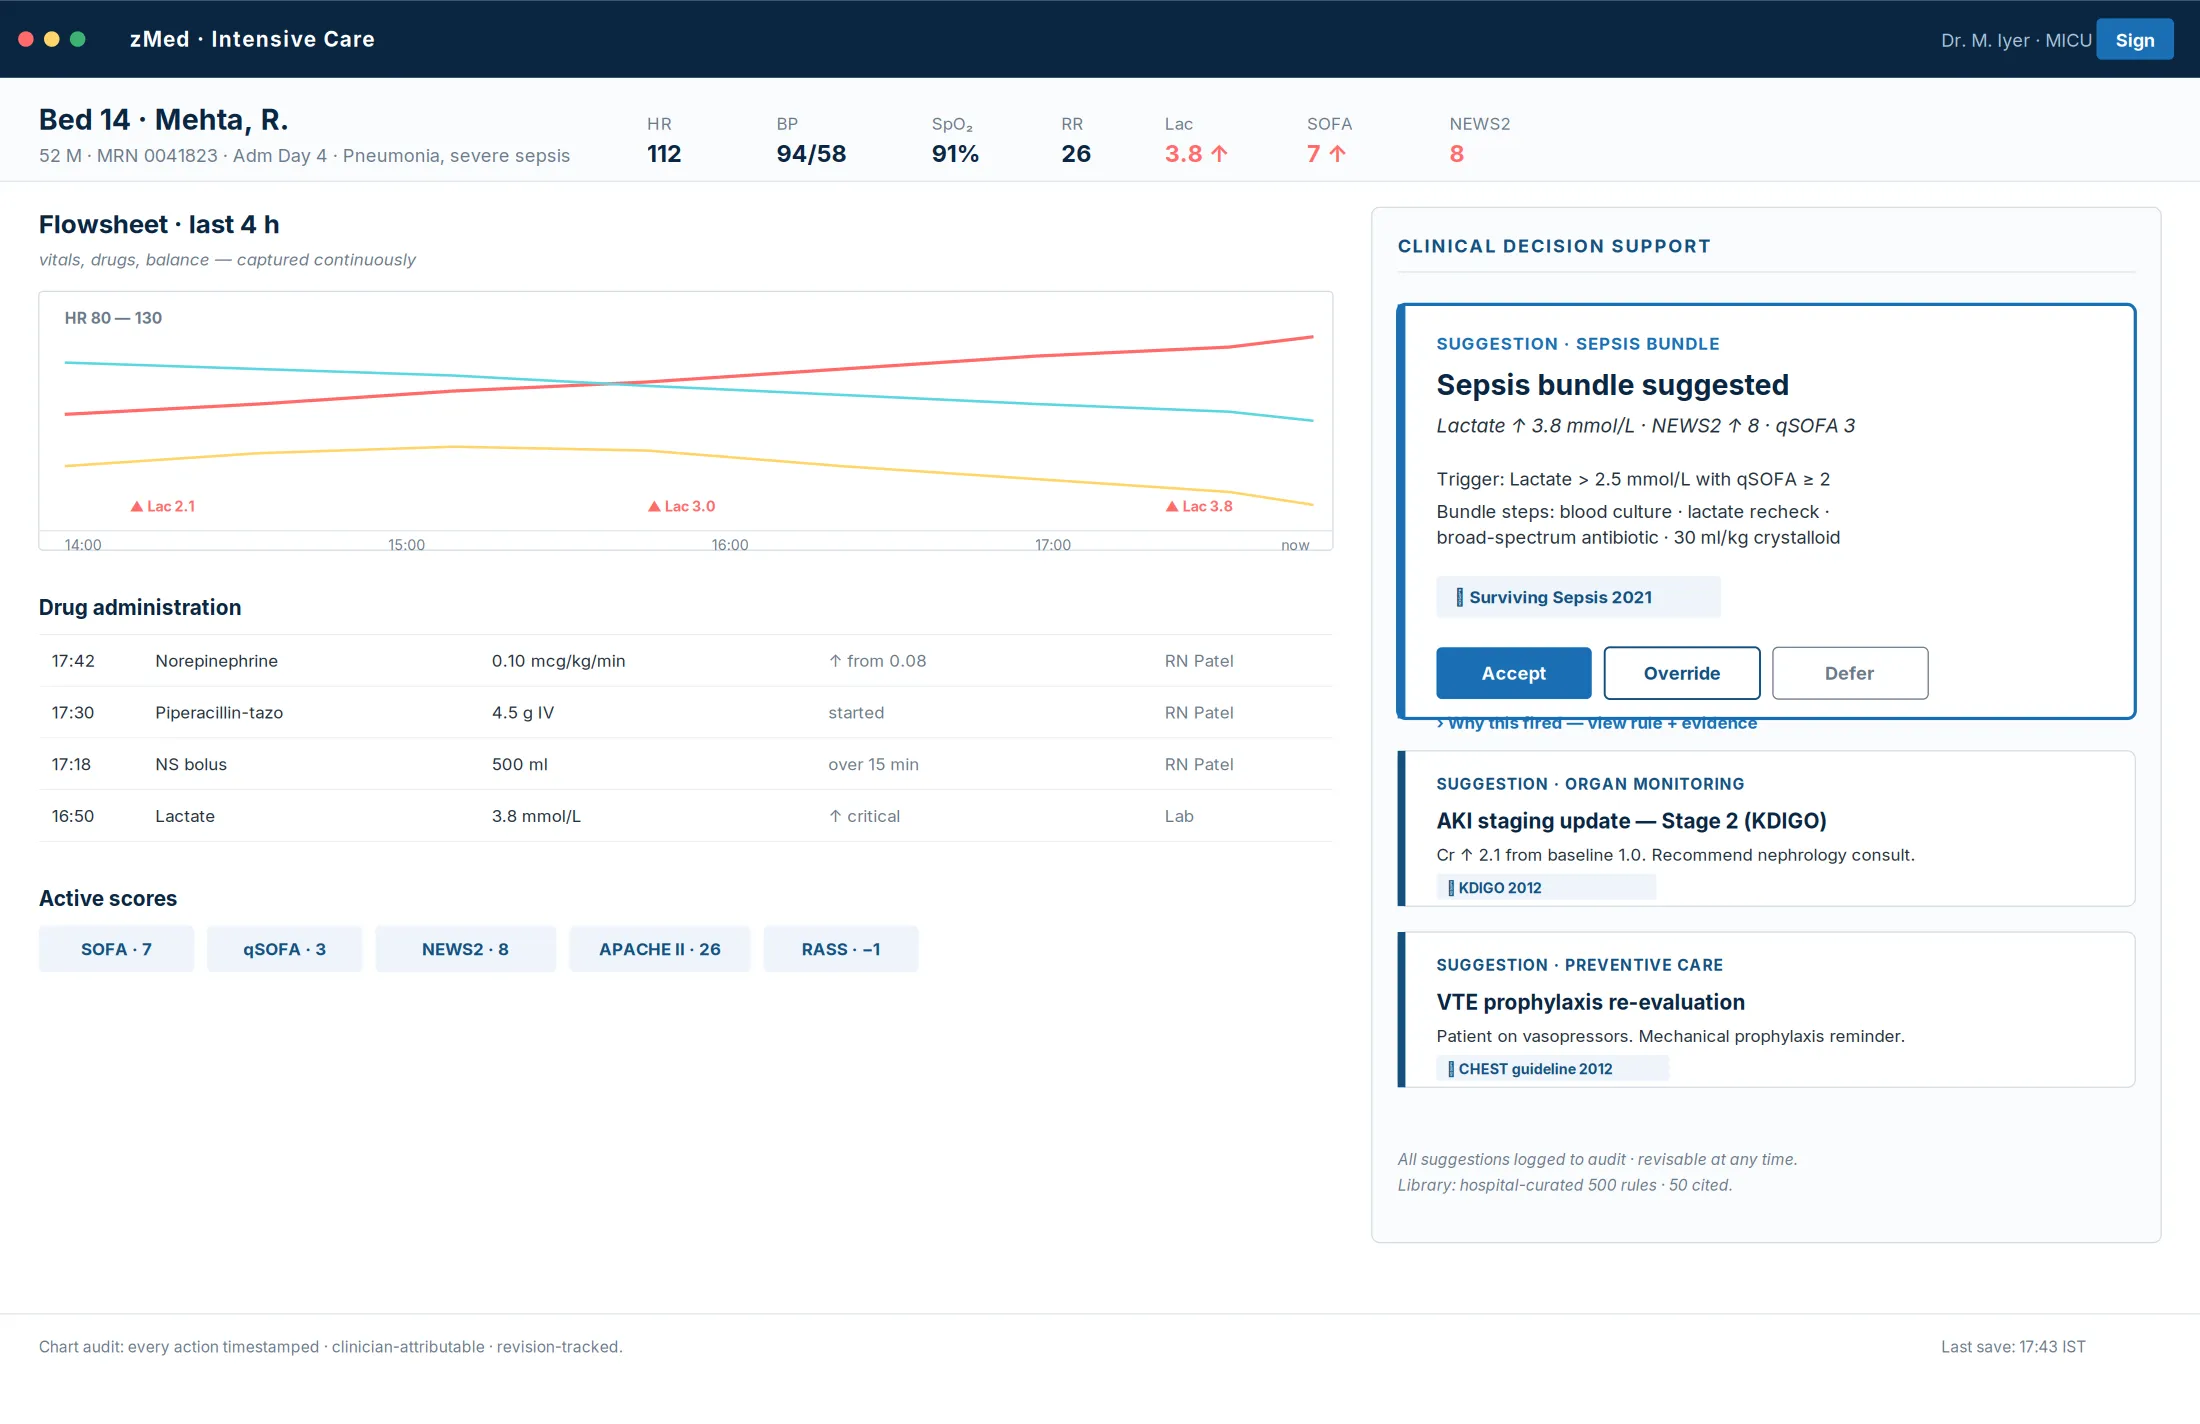
The scale is the point. A ventilated patient produces over 1,400 chart-able points a day, a twenty-bed unit 28,000+ rows, and traditionally under 5% is meaningfully analysed before the next decision. zMed reads every row. Twelve clinical scores recalculate continuously — SOFA, APACHE II, GCS, NEWS2, MEWS, qSOFA, RASS, CAM-ICU and more — each literature-cited, cited not claimed. Predictive risk surfaces deterioration and sepsis 4–6 hours pre-clinical, as native flowsheet entries, advisory only.
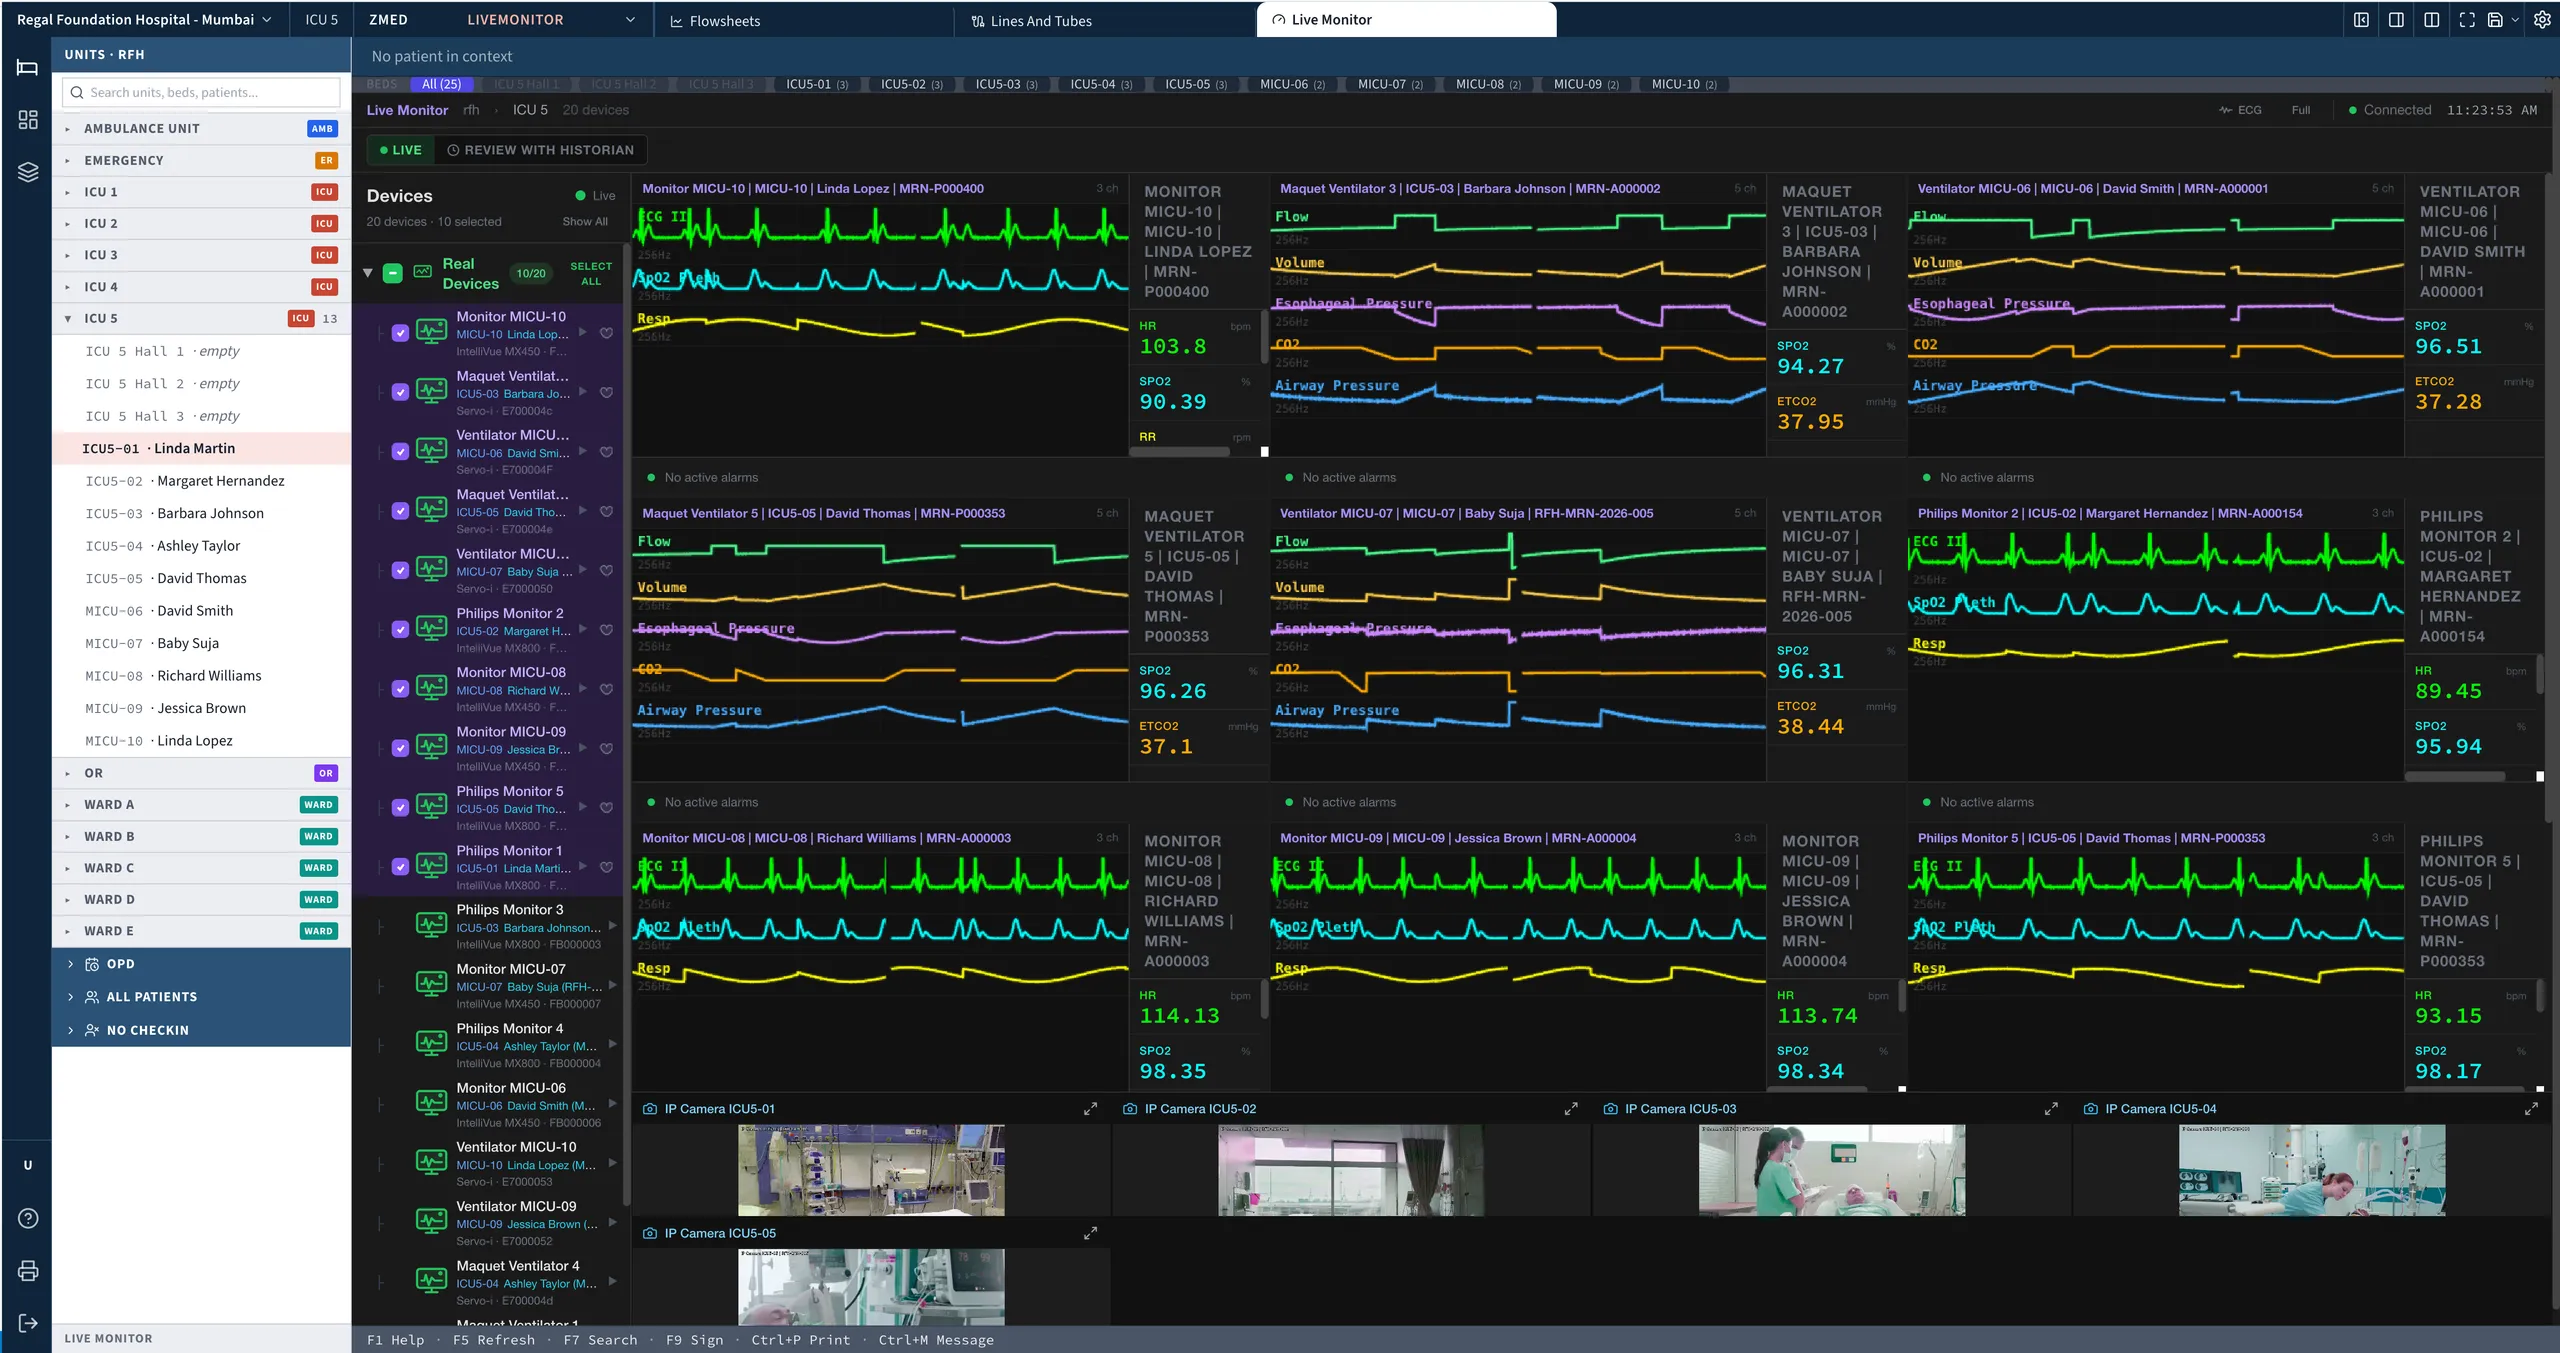
The unit-wide Live Monitor shows every bed in one grid: vitals, colour-coded acuity and shift status visible from across the bay, each tile carrying the last hours of the most relevant vitals. It is configurable per nursing shift, per bed and per role, and smart suppression cuts alarm load 60–85%, so the team responds to signal rather than fatigue. Around the chart sit parenteral-nutrition planning, an analytics layer surfacing census, throughput, length of stay and bundle compliance, and an audit trail that captures every chart action with timestamp, user and prior value — every override carrying a reason and every score its citation. The result is one comprehensive, audit-ready record per encounter: adult, paediatric, neonatal, live and continuous.
Explore more
Other modules & products
Tele-ICU & Command Center
One specialist, every bed, every site
Operating Room & Anaesthesia
The chart that writes itself
Emergency & Triage (ER)
The pathway opens at the door
Ambulance & Pre-Hospital
Care that starts before arrival
HIS & ERP
One platform, not two systems
Clinical Decision Support (Comprehensive)
Guidance where the decision is made
Clinical AI (Comprehensive)
“Is this about to happen?”