28-bed tertiary ICU · Middle East · 28 ICU beds · every bedside device connected · 12 scores live · TPN in the chart
The ICU that stopped re-keying
Anonymized deployment · reference conversations arranged for qualified evaluations
100%
device vitals into the chart, no re-entry
60–85%
reduction in alarm load
12
clinical scores recalculated continuously
Weeks
from kickoff to big-bang go-live
A multi-specialty tertiary centre replaced paper flowsheets and manual vitals transcription across its intensive care unit. Every monitor, ventilator and infusion pump now streams into one living flowsheet; smart alarm suppression cut the unit’s alarm load by more than half, and continuous SOFA, NEWS2 and sepsis scoring surfaces deterioration hours earlier than the paper round ever did.
The challenge
The unit ran the way most tertiary ICUs still do: a paper flowsheet at the end of every bed, and a nurse copying monitor readings onto it every hour. Ventilator settings were transcribed at handover. Infusion rates were written down when they changed — if the moment allowed. Severity scores were worked out by hand at the morning round, from observations that were already hours old by the time the team discussed them.
The cost was not only nursing time. Transcription is where errors creep in, where a continuous trend gets flattened into a single hourly value, and where early deterioration hides between entries. And with every monitor, ventilator and pump alarming independently into the room, the unit’s soundscape had become something staff had learnt to tune out — which is exactly the danger alarm fatigue poses.
The deployment
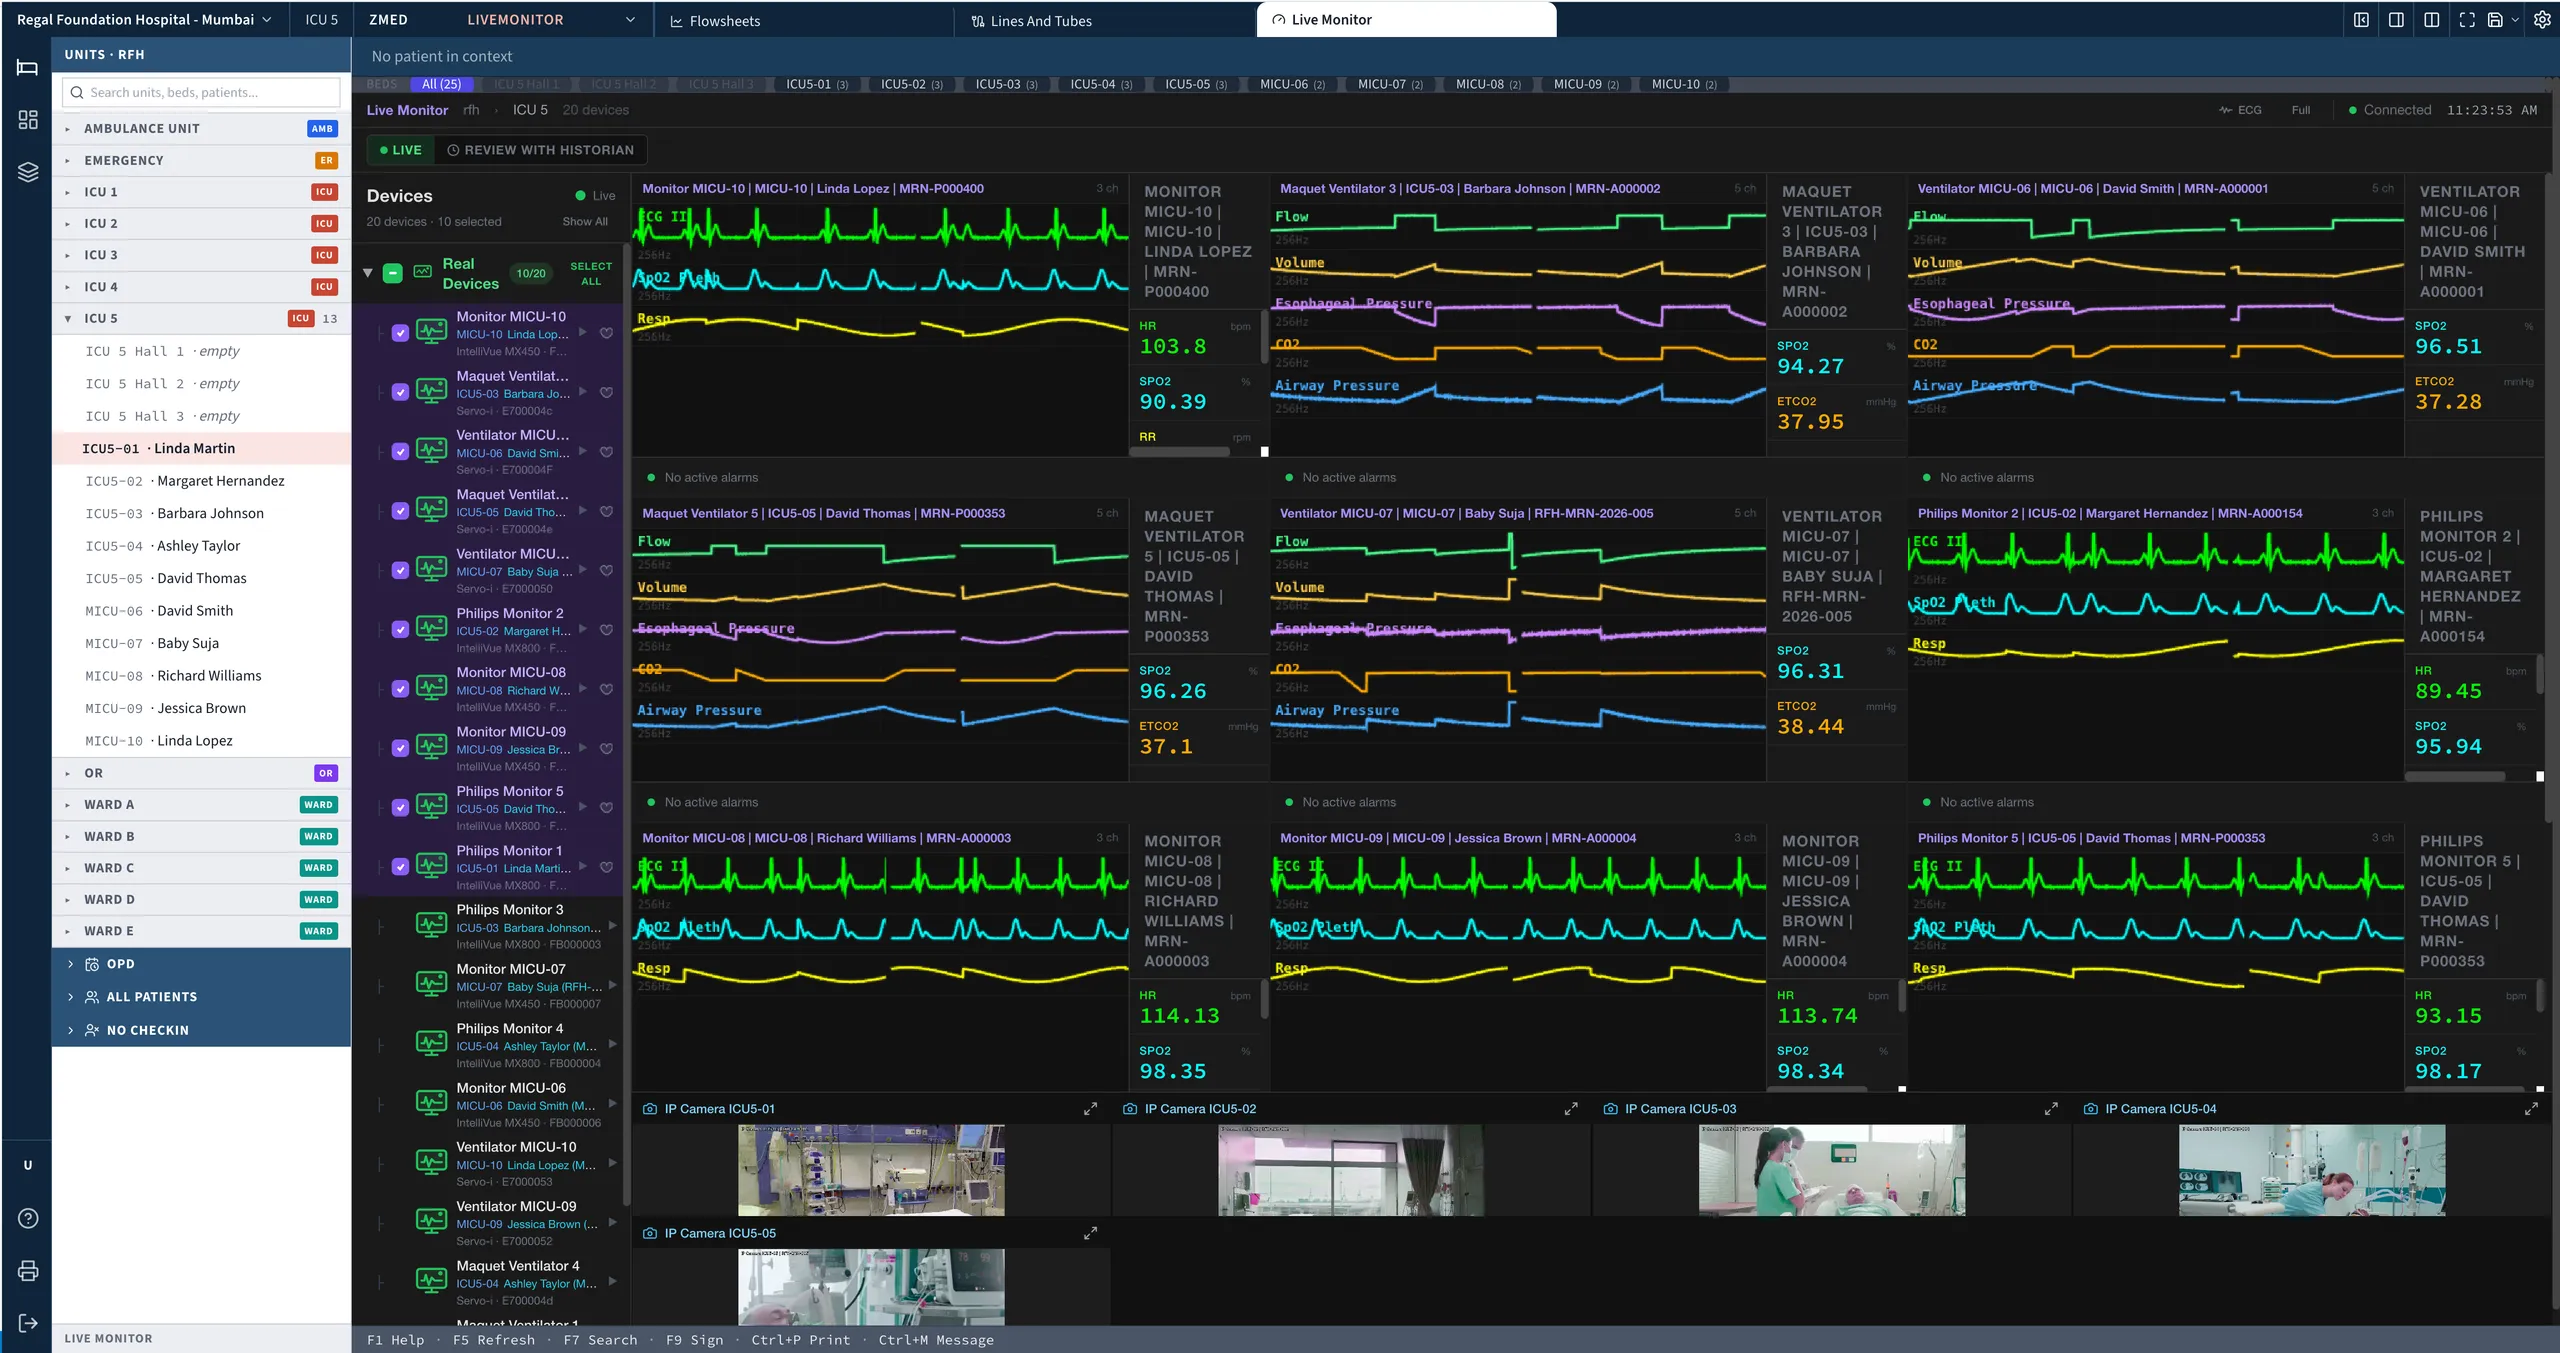
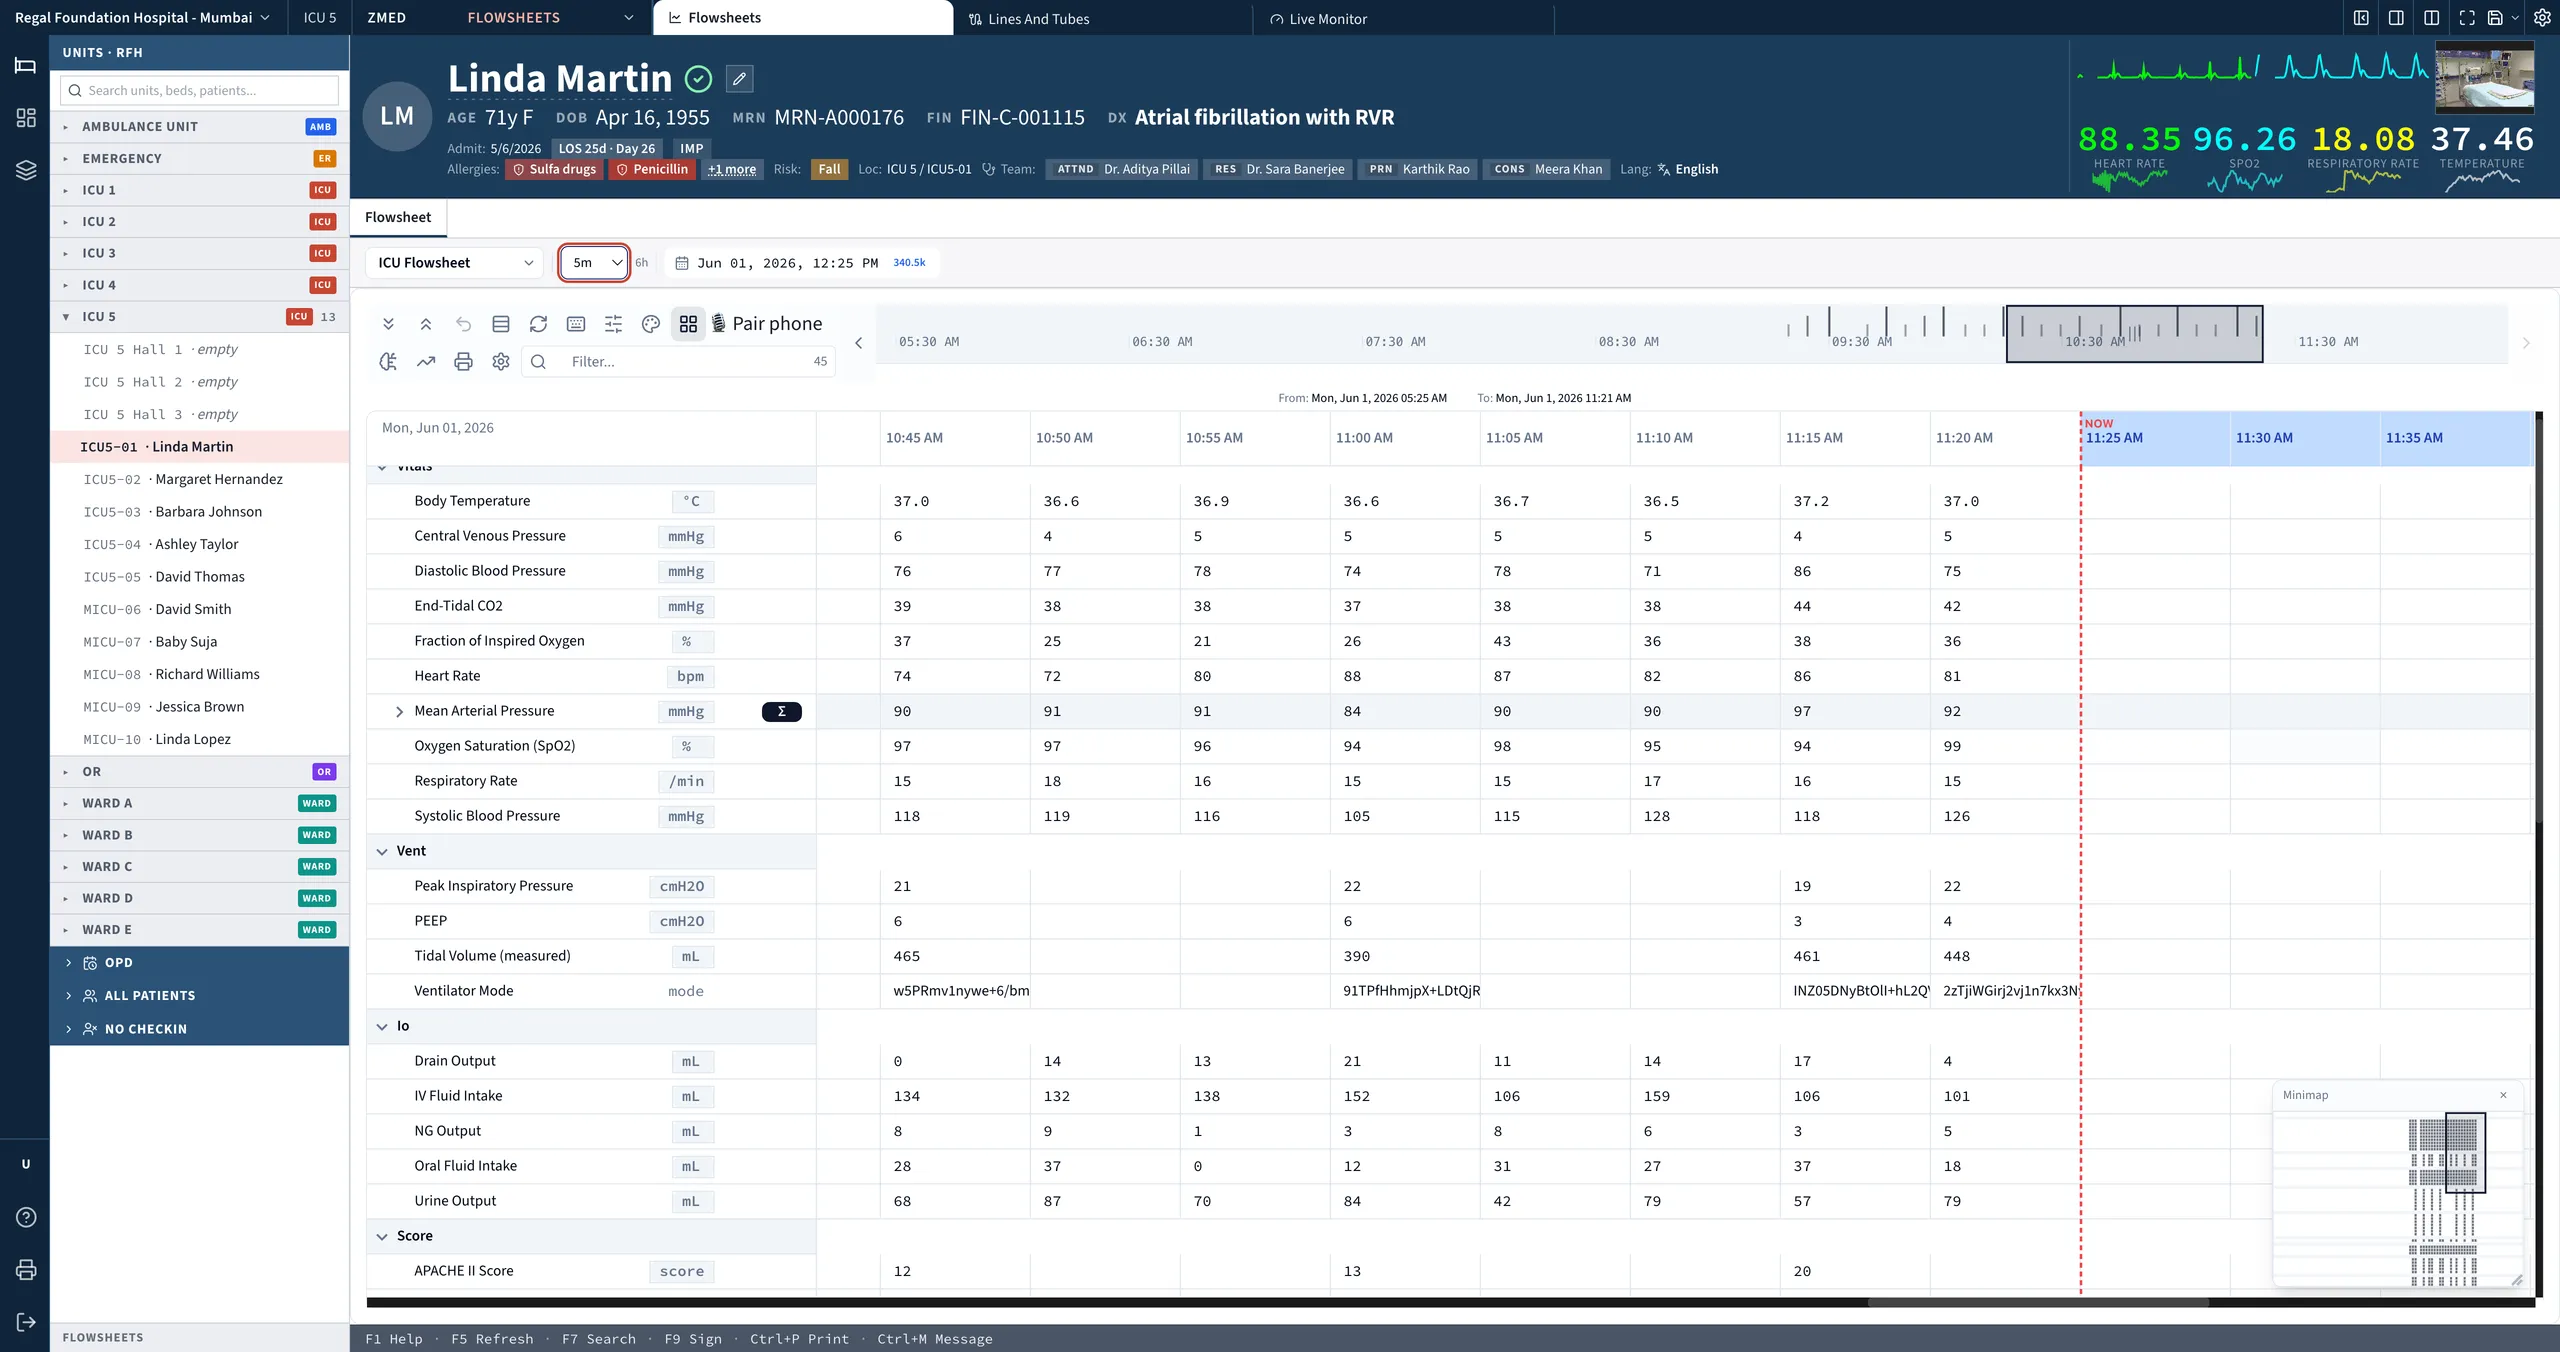
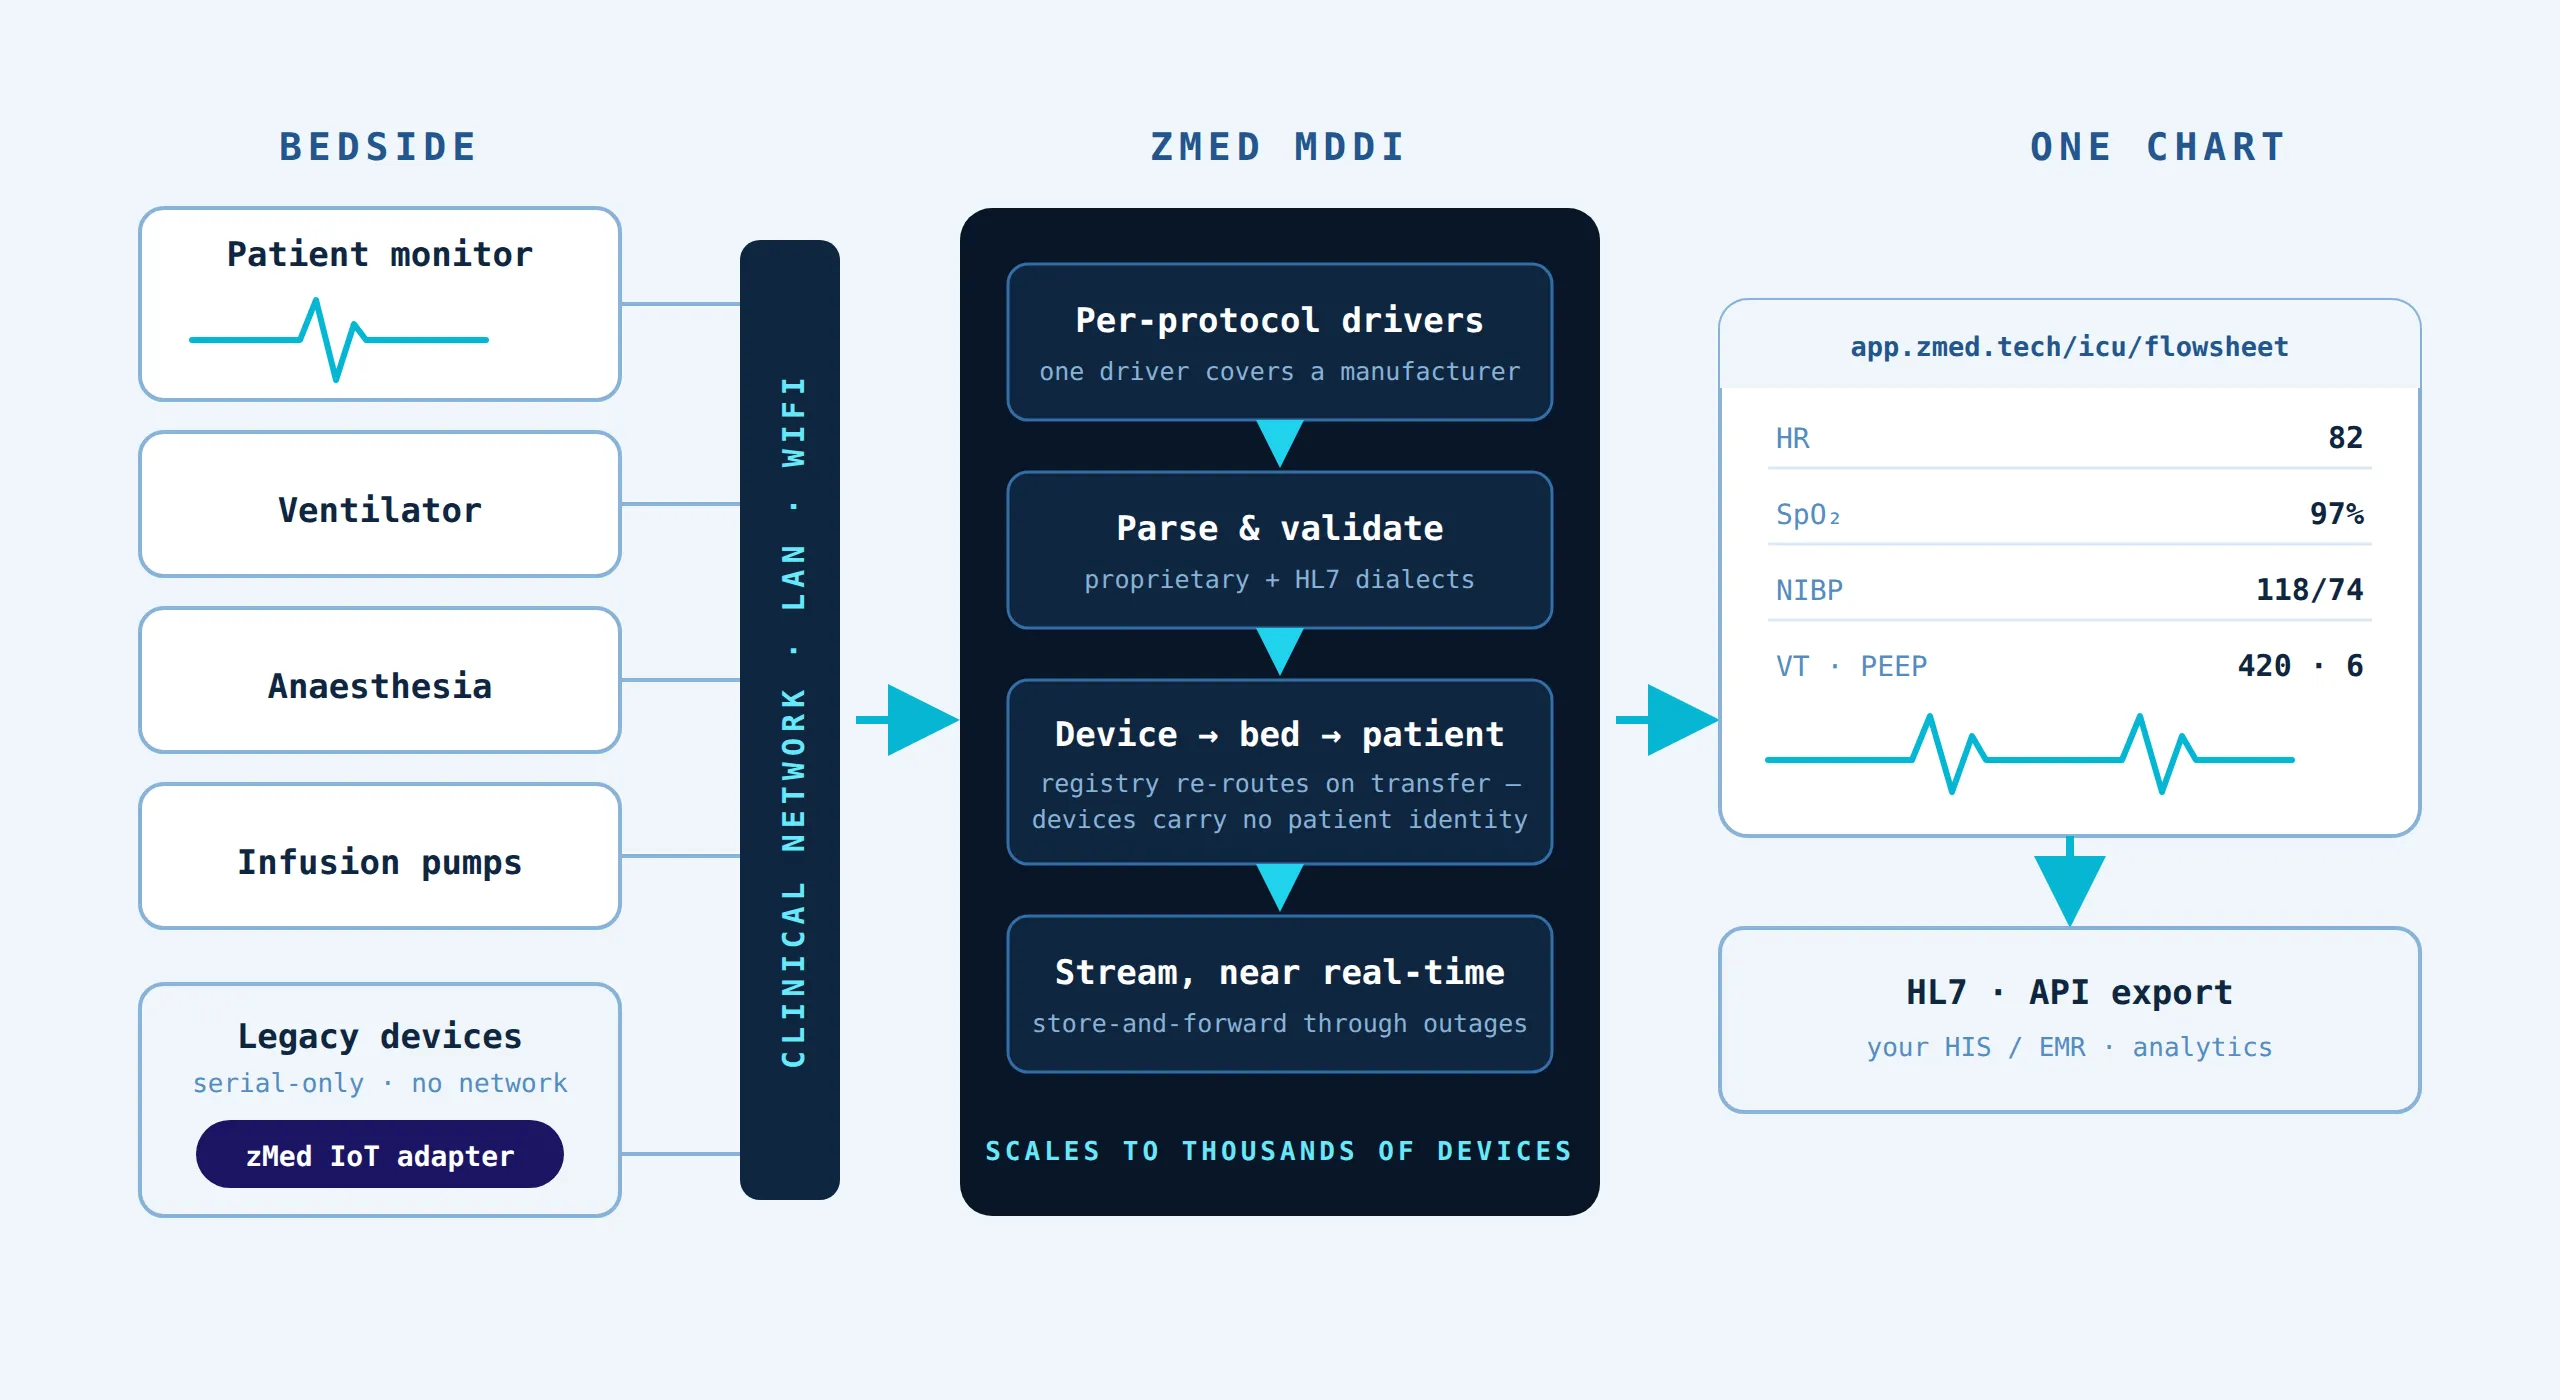
zMed connected every bedside device in the unit — patient monitors, ventilators and infusion pumps — directly into one living flowsheet. Observations stream in continuously and land in the chart as they happen, so the nurse’s role changed from transcribing values to validating them: charting by exception instead of copying numbers the chart already holds.
Alarm management was tuned to the unit’s own thresholds and escalation rules, suppressing the nuisance alarms that had trained everyone to stop listening while making the genuinely urgent ones impossible to miss. Twelve clinical scores — SOFA, NEWS2 and sepsis screening among them — now recalculate continuously as new observations arrive, rather than once per round when someone finds time for the arithmetic.
Parenteral nutrition moved into the chart too. TPN prescriptions are calculated from the patient’s current weight, fluid balance and labs already in the record — composition worked out in the chart instead of on a calculator at the nursing station, with every prescription documented against the data that justified it.
The go-live was big-bang: all twenty-eight beds switched to the living flowsheet together, weeks from kickoff — no months of running paper and screen side by side. Nursing, medical and biomedical teams were trained at the bedside in the run-up, on their own unit, rather than in a classroom, so the cutover day changed the chart, not the routine. A device-status view gives the biomedical team the same picture the clinicians see: every connected device, every bed, at a glance.
What changed
The unit measures the difference in four numbers.
100% of device vitals reach the chart with no re-entry. Nothing is transcribed and nothing is lost between hourly entries; the trend a clinician sees at the bedside is the trend in the record.
Alarm load fell by 60–85%. Fewer interruptions per shift, and the alarms that do sound carry meaning again. The unit is quieter, and the quiet is clinically safer than the noise was.
Twelve clinical scores stay continuously current. Deterioration the paper round would have caught at eight in the morning now surfaces hours earlier, while there is still time to act on it.
Big-bang go-live, weeks from kickoff. The unit did not run a year-long IT programme — every bed went live on the same day, with the team trained and the devices connected ahead of the switch. Clinical confidence was won in the preparation, not stretched over a phased rollout.
Behind the numbers sits a quieter change: nurses spend their hour at the bedside on the patient, not on the paperwork about the patient.
What the team says
The head of critical care puts the change in terms of the daily round:
“The chart is simply there when I round. The scores are current, the trends are visible, and my nurses chart by exception instead of transcribing monitors.”
That is the whole shift in one sentence. The round no longer begins by reconstructing the night from hourly entries; it begins from a chart that is already current, with scores already computed and trends already drawn. The conversation at the bedside starts where it should — with what to do next, not with what the numbers were.
“The chart is simply there when I round. The scores are current, the trends are visible, and my nurses chart by exception instead of transcribing monitors.”
Head of Critical Care, 28-bed tertiary ICU
Every figure above is measured as described on the methodology page. Thinking about replacing an incumbent system? Here is how the seam is managed.